Figures & data
Figure 1. J-PARC facility layout.
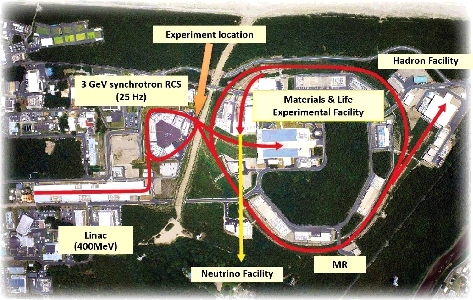
Figure 2. A schematic layout of the experimental location in J-PARC. A rectangular indicated by the arrow shows the chamber position.
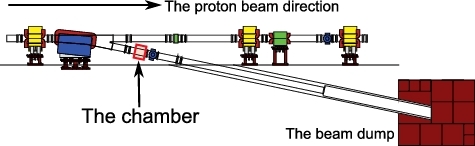
Figure 3. A chamber views. (a) the front view of the chamber; (b) the side view of the chamber.
Figure 4. A schematic and real view of sample holder. (a–c) Drawings; (d) A real view of the sample and the holder.
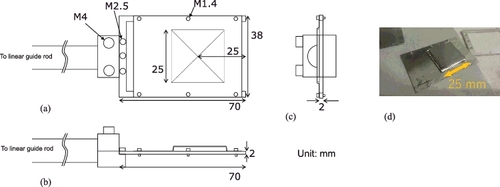
Table 1. Proton-beam parameters for irradiation
Table 2. Properties of activation products
Figure 5. Typical spectrum of Al 47 hours after irradiation with 2.2 GeV proton.
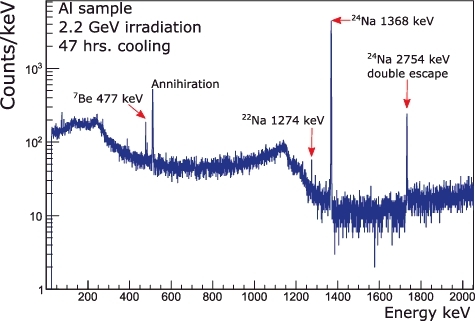
Table 3. Table of uncertainties
Figure 6. A schematic drawing of the proton number correction (6-2) and a real image of the imaging plate (6-1).
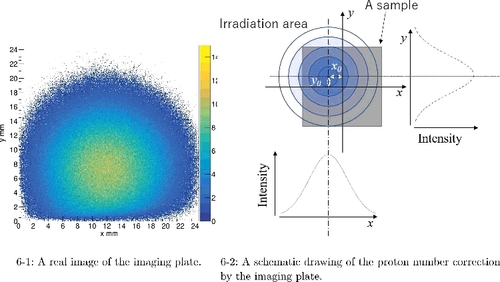
Table 4. The activation cross sections. Only statistical uncertainty is shown
Figure 7. The measured activation cross sections. This works (full circle) and other experiments (other symbols) taken from EXFOR [Citation3,Citation10–18] data are plotted. (7-1) 27Al(p, X)7Be (7-2) 27Al(p, X)22Na (7-3) 27Al(p, X)24Na.
![Figure 7. The measured activation cross sections. This works (full circle) and other experiments (other symbols) taken from EXFOR [Citation3,Citation10–18] data are plotted. (7-1) 27Al(p, X)7Be (7-2) 27Al(p, X)22Na (7-3) 27Al(p, X)24Na.](/cms/asset/a2b56996-5265-4f92-a0cd-2a239657496d/tnst_a_1461694_f0007_oc.jpg)
Figure 8. (color online). Residue mass production of 208Pb+p reaction.
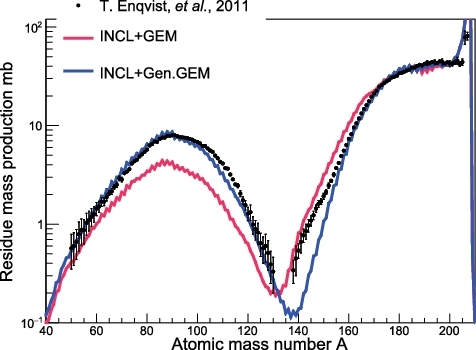
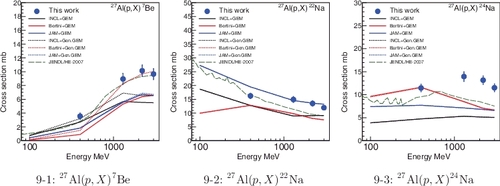
Figure 9. (color online). The measured, calculated, and evaluated activation cross sections. Same calculation results were obtained for the cross sections of 27Al(p, X)22Na and 27Al(p, X)24Na. (a) 27Al(p, X)7Be (b) 27Al(p, X)22Na (c) 27Al(p, X)24Na.