Figures & data
Figure 1. (a) Schematic of experimental environment. Arrows show the installation locations of the Compton camera for radiation imaging. The direction of the arrows shows the center of the FOV of the Compton camera. The unit of length values is m, and the error in the values is less than 10%. The photographs in panels (b) and (c) show the hotspot locations. The values of dose rate in the photographs were measured using a handheld survey meter.
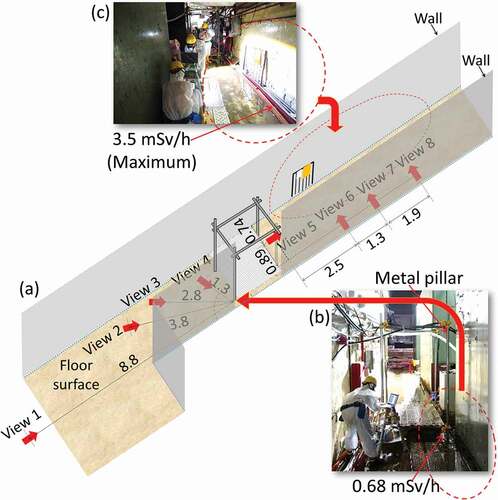
Figure 2. Measurement results of radiation imaging using Compton camera. The installation locations of the Compton camera are displayed above each panel (see )). Left and right panels show the photographs captured using the optical camera of the Compton camera and the reconstructed radiation image measured at each measuring point. The measurement time was 39.5 s for each panel.
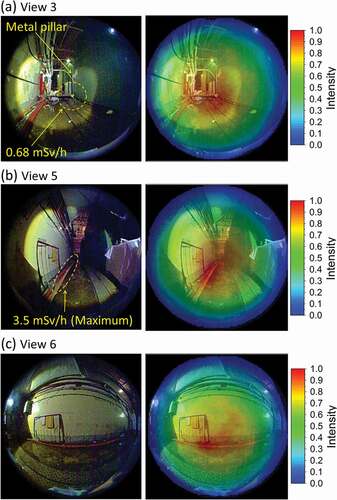
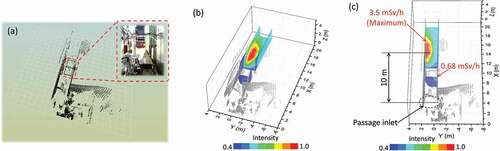
Figure 3. (a) Point cloud data of experimental environment acquired using scanning LRF. Combined metal pipes can be seen. (b,c) Radiation distribution map prepared by superimposing radiation image and point cloud data. In panels (b) and (c), the viewpoints are different.