Figures & data
Figure 1. Evolution of heat generation rate of UO2 and MOX spent fuel per THM.
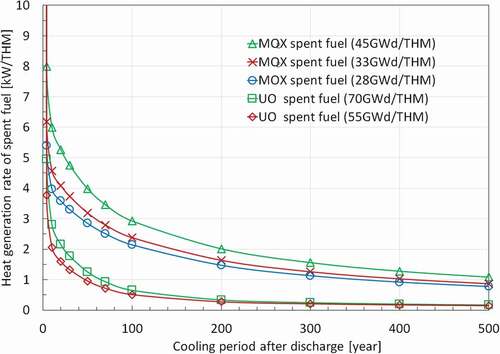
Figure 2. Contribution of minor actinides in UO2 spent fuel (70GWd/THM) on heat generation rate.
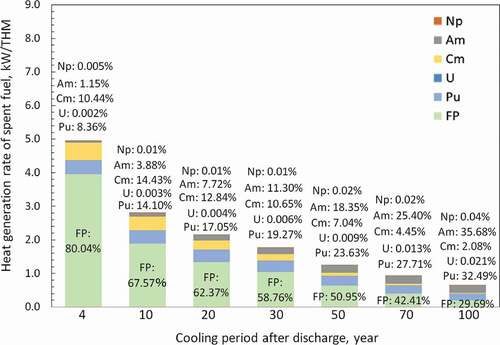
Figure 3. Contribution of minor actinides in MOX spent fuel (45GWd/THM) on heat generation rate.
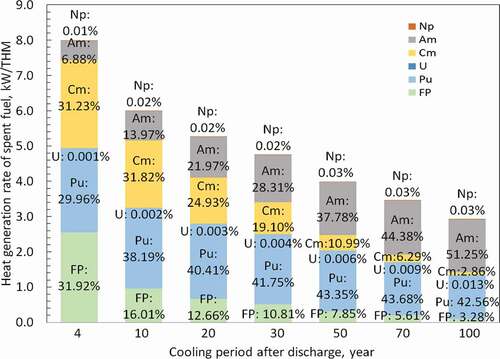
Figure 4. Contribution of transuranium isotopes in MOX spent fuel (45GWd/THM) on heat generation rate.
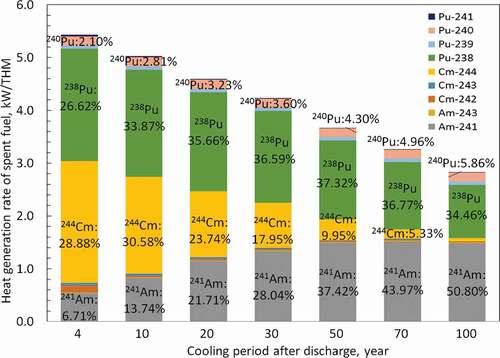
Table 1. Waste loading and number of glass units per THM at various conditions of burn-up and cooling period (upper table, UO2 fuel; lower table, MOX fuel)
Table 2. Required separation ratio of Mo and PGM and waste loading of waste glass
Figure 5. Number of glass units per THM with respect to restriction factors of waste loading of waste glass and effects of cooling period of spent fuel; (a) UO2 fuel, (b) MOX fuel.
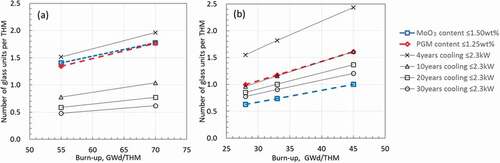
Figure 6. Number of glass units per GWd with respect to restriction factors of waste loading of waste glass and effects of cooling period of spent fuel; (a) UO2 fuel, (b) MOX fuel.
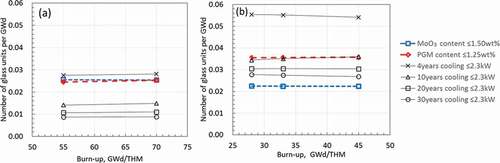
Figure 7. Evolution of heat generation rate of waste glass with 4 years cooling period of spent fuel; (a) UO2 fuel, (b) MOX fuel.
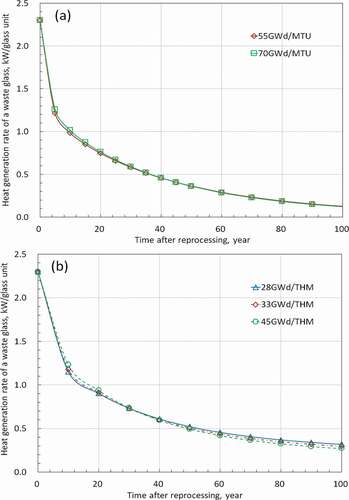
Table 3. Effects of Am separation on heat generation rate and storage period before disposal for waste glass from MOX spent fuel with burn-up of 45GWd/THM
Figure 8. Effects of extended cooling period on evolution of heat generation rate of waste glass; (a) UO2 fuel with burn-up of 70GWd/THM, (b) MOX fuel with burn-up of 45GWd/THM.
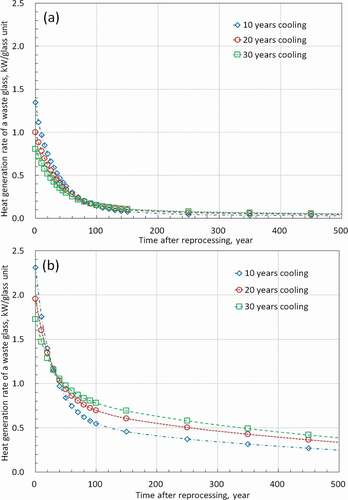
Figure 9. Contribution of minor actinides on heat generation rate of waste glass (MOX fuel, Burn-up; 45GWd/THM, Cooling period of spent fuel; 10 years).
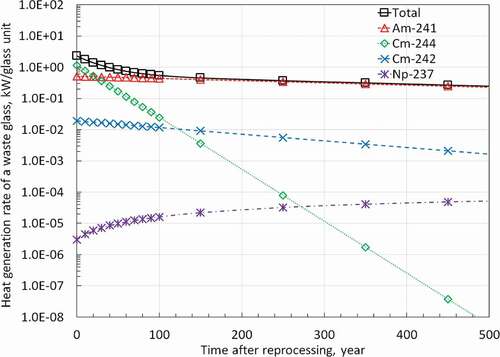
Figure 10. Evolution of heat generation rate of waste glass as a function of Am separation ratio; (a) overall figure, (b) enlarged figure (MOX fuel, Burn-up; 45GWd/THM, Cooling period of spent fuel; 10 years).
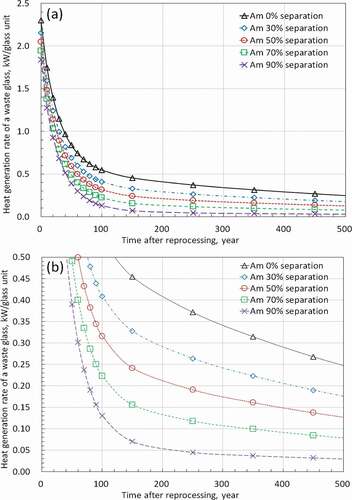
Figure 11. Relationship between the maximum temperature of buffer material and occupied area per waste package corresponding to (a) and 8 (a) (UO2 fuel, Burn-up; 70GWd/THM).
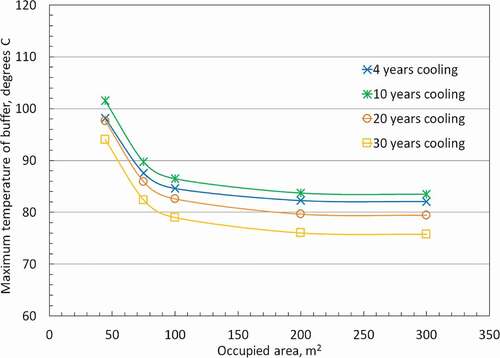
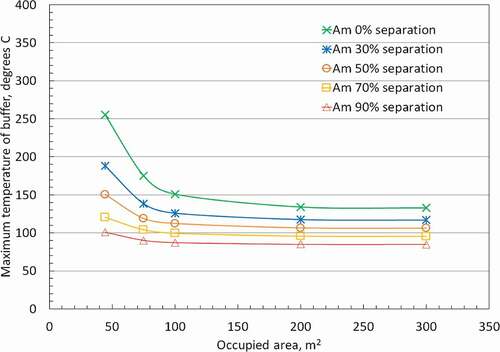
Figure 12. Relationship between the maximum temperature of buffer material and occupied area per waste package corresponding to (b) and 8 (b) (MOX fuel, Burn-up; 45GWd/THM).
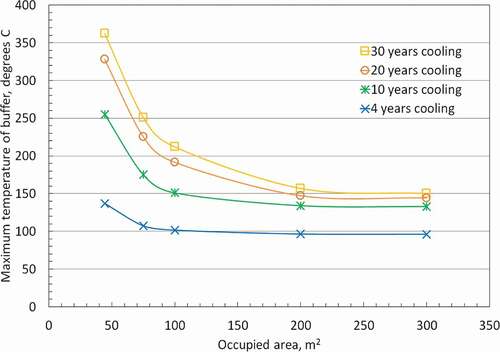
Figure 13. Relationship between the maximum temperature of buffer material and occupied area per waste package corresponding to (MOX fuel, Burn-up; 45GWd/THM, Cooling period of spent fuel; 10 years, Am separation is applied).