Figures & data
Figure 1. Core nodalization.
Table 1. CDF contribution by initiating events (APR1400) [Citation8]
Figure 2. Event tree for the representative sequence.
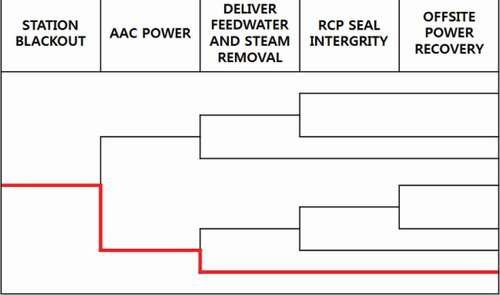
Figure 3. Pressure and core exit temperature for the representative case without SAM actions.
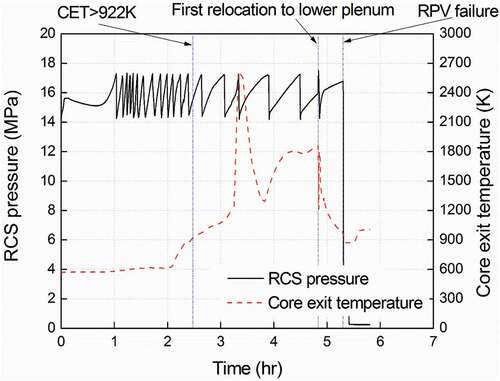
Figure 4. Types of solid core geometry during melt progression [Citation9].
![Figure 4. Types of solid core geometry during melt progression [Citation9].](/cms/asset/7429de26-8bef-475d-8c84-cfaa2bfc4d1f/tnst_a_1483844_f0004_b.gif)
Figure 5. Breach of side crust of molten pool [Citation9].
![Figure 5. Breach of side crust of molten pool [Citation9].](/cms/asset/75780eef-2be6-4d5a-a8e1-de814f1dddeb/tnst_a_1483844_f0005_b.gif)
Table 2. Analysis results according to depressurization timing
Figure 6. Water level in core for A01 case.
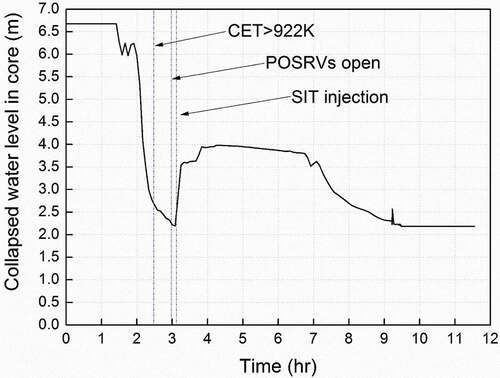
Figure 7. Molten mass in core for cases A01 to A05.
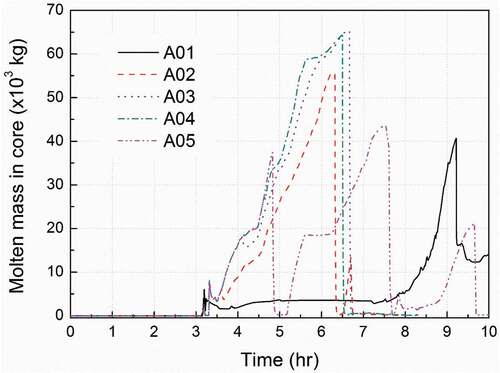
Table 3. Analysis results according to in-vessel injection timing with flow rate of 10 kg/sec
Figure 8. Molten mass in core for cases B01 to B08 (with in-vessel injection before the first relocation to lower plenum).
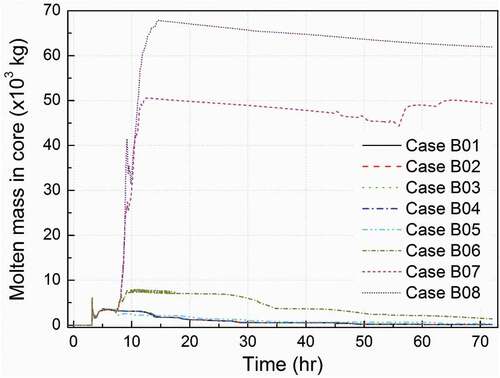
Figure 9. Core node map at the end of simulation for case B05 (left) and case B08 (right).
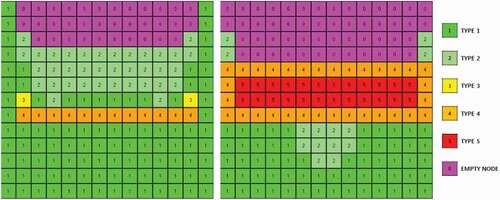
Figure 10. Total debris mass in RPV lower plenum for cases B08 to B11 (in-vessel injection after the first relocation to lower plenum).
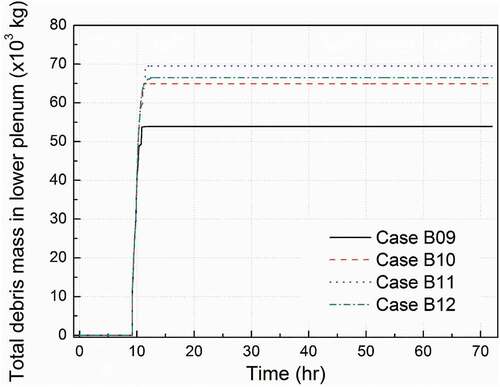
Table 4. Analysis results according to in-vessel injection timing with flow rate of 30 kg/sec
Table 5. Analysis results according to in-vessel injection timing with flow rate of 50 kg/sec
Figure 11. Total debris mass accumulated in lower plenum as a function of timing for different in -vessel injection flow rates.
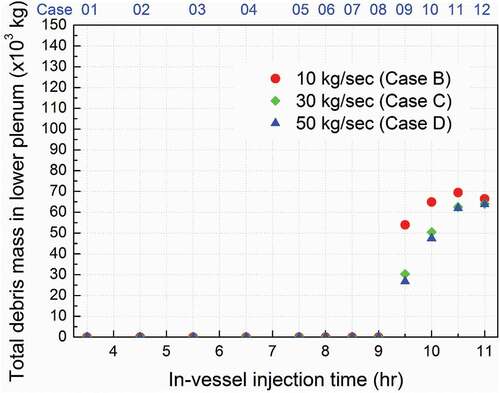
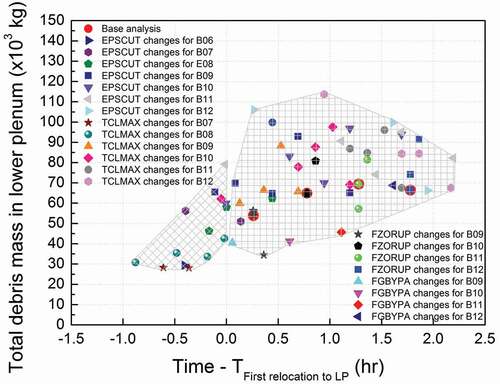
Figure 12. Debris mass changes in sensitivity analysis.
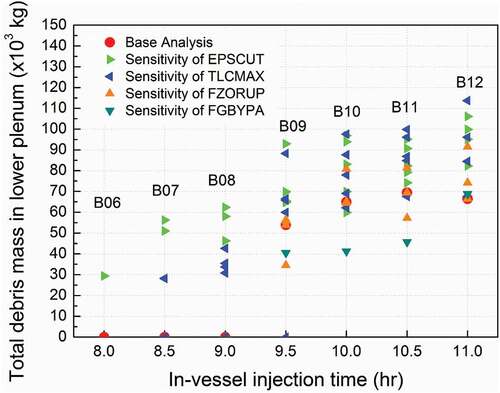
Figure 13. Success region for in-vessel injection without the first relocation to the RPV lower plenum.
Figure 14. Metallic layer mass fraction in RPV lower plenum.
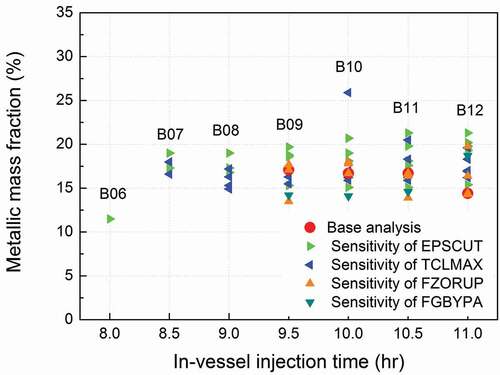
Figure 15. Total debris mass as a function of the time of the first relocation.