Figures & data
Figure 1. Present status on total cross sections of 241Am.
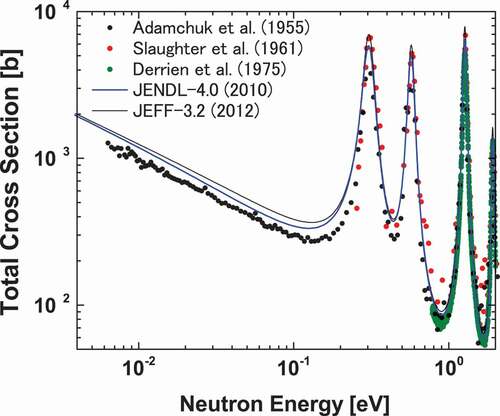
Table 1. Characteristics of the samples
Figure 2. PH spectra of the 6Li detector and the 7Li detector.
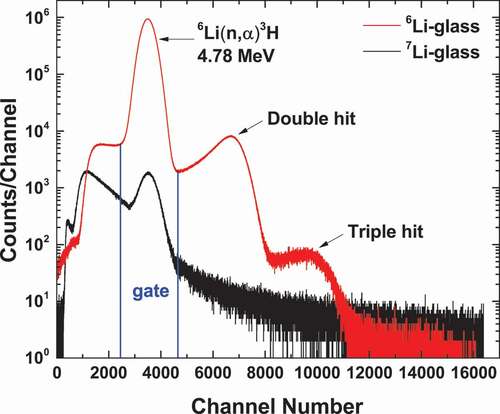
Figure 3. Gated TOF spectra of the 241Am and the dummy samples measured with the 6Li-glass and the 7Li-glass detectors. The red and the green lines show the neutron TOF spectra measured by the 6Li-glass detector. The black and the blue lines show the gamma-ray backgrounds measured by the 7Li-glass detector, which are nearly equal to each other. Each TOF spectrum was normalized with the number proton beam pulses.
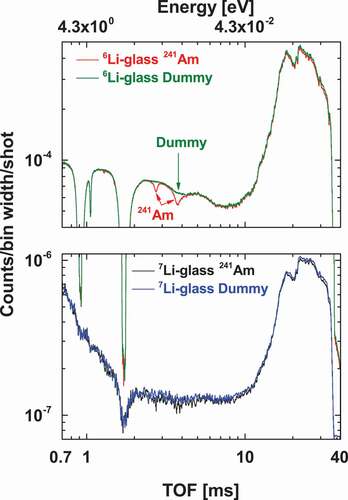
Figure 4. The gated neutron TOF spectra and the frame-overlap background of the 241Am sample. The red line shows the gated neutron TOF spectra measured by the 6Li-glass detector. The black line shows the deduced frame-overlap background.
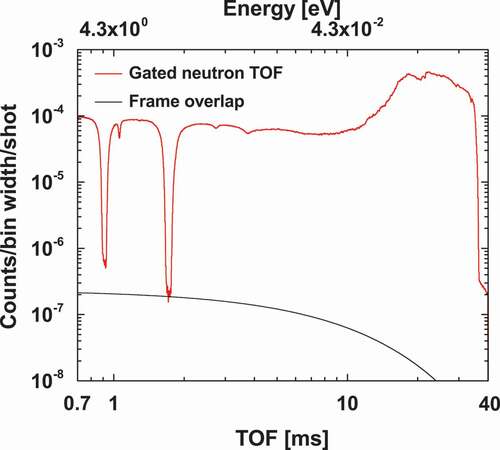
Figure 5. The neutron transmission ratio of 241Am.
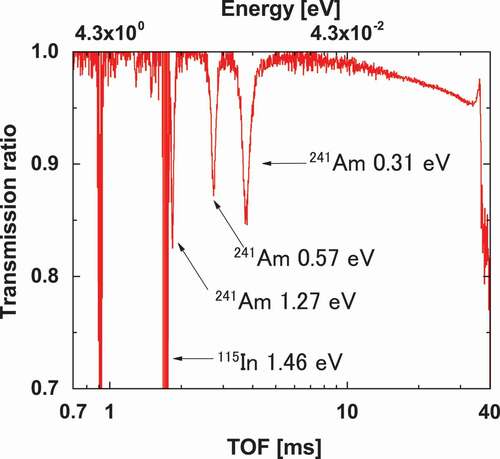
Figure 6. The derived neutron total cross sections of 241Am (red points) with comparison to the results by Adamchk [Citation13] (black points), the evaluated values in JENDL-4.0 [Citation4] (blue line), and JEFF-3.2 [Citation43] (black line).
![Figure 6. The derived neutron total cross sections of 241Am (red points) with comparison to the results by Adamchk [Citation13] (black points), the evaluated values in JENDL-4.0 [Citation4] (blue line), and JEFF-3.2 [Citation43] (black line).](/cms/asset/af067f45-9ac3-4ba1-9d80-cf3e46260239/tnst_a_1485519_f0006_oc.jpg)
Table 2. Measuring times
Figure 7. The correction factor of the neutron self-shielding and multiple scattering in the 10B sample.
Figure 8. Incident neutron energy spectrum determined by measuring the 478 keV gamma-ray from the 10B(n, )7Li reactions.
Figure 9. A comparison between calculated and measured response functions for a 60Co source. The calculated response function was normalized with the number of emitted gamma-rays. Differences of the peak areas on the 1173 and 1332 keV between the experiment and the calculation were less than 2%.
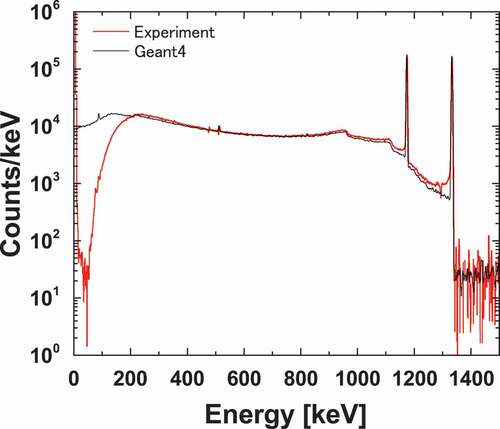
Figure 10. The calculated weighting function for the 241Am sample without the normalization.
Figure 11. The PH spectra of the 241Am (red), dummy (black), 208Pb (blue), and 241Am decay (green) measurements. These PH spectra were normalized using the number of proton beam pulses. Sample-independent background estimated from the PH spectra for the blank measurement was subtracted.
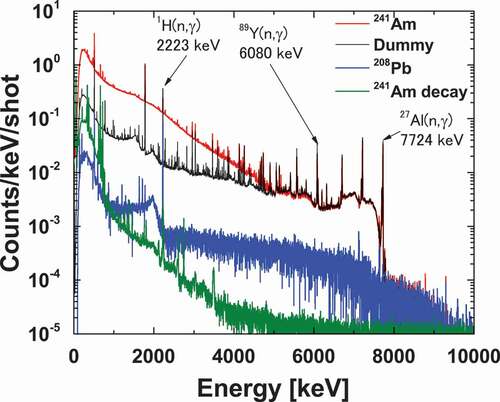
Figure 12. The weighted sum TOF spectra of the 241Am, dummy, 208Pb, and blank. These weighted sum TOF spectra were normalized with the number of proton beam pulses. Red line is the 241Am, black line is the dummy, green line is the 208Pb, and blue line is blank.
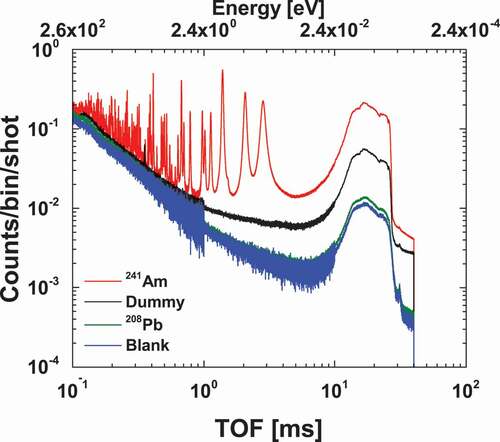
Figure 13. The dead-time corrections for the weighted TOF spectra of the 241Am and dummy measurements.
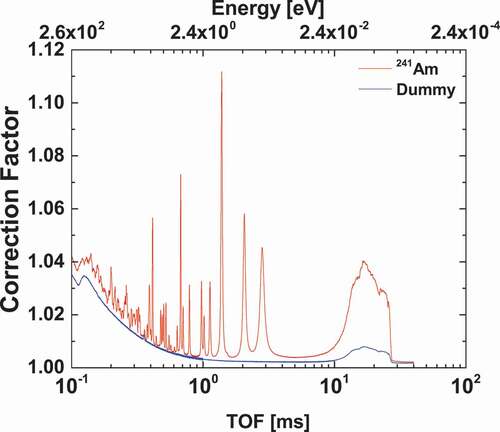
Figure 14. The background of frame-overlap neutrons compared with the weighted TOF spectrum of the 241Am sample.
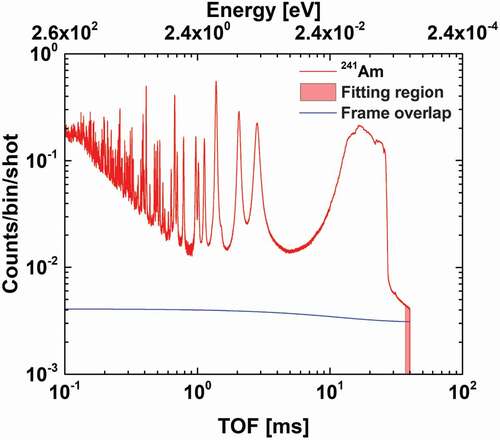
Figure 15. The correction for neutron self-shielding and multiple-scattering on the 241Am sample.
Figure 16. The correction for neutron self-shielding and multiple-scattering on the 197Au sample.
Figure 17. The correction for the fission reaction of 241Am.
Table 3. Details of uncertainties for the derived thermal capture cross section of 241Am
Table 4. The thermal neutron capture cross sections () of 241Am
Figure 18. The determined neutron capture cross sections of 241Am. (a) 0.01 - 2eV, (b) 2 - 10 eV and (c) 10 - 100eV.
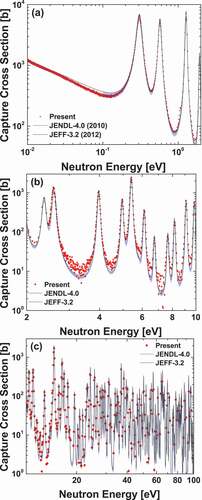
Figure 19. The uncertainties of the derived neutron capture cross sections of 241Am. A step appeared at neutron energy of 2.4 eV following a change of the TOF bin width.