Figures & data
Table 1. Chemical compositions of the materials used in the present study (wt%)
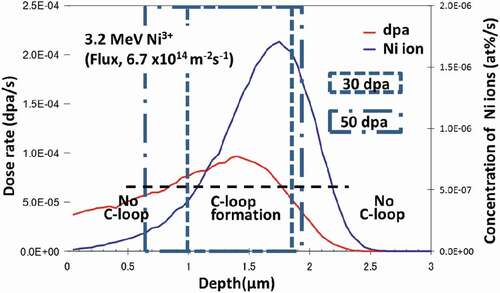
Figure 1. (a) SRIM calculation of the damage distribution in Zr irradiated by Ni ions at 3.2 MeV and (b) the specimen chamber used for the irradiation.
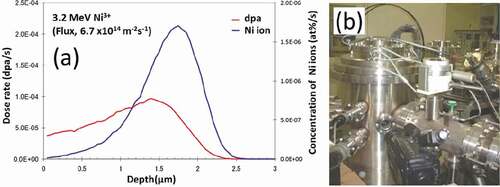
Figure 2. STEM-EDS mapping of annealed Zircaloy-2.
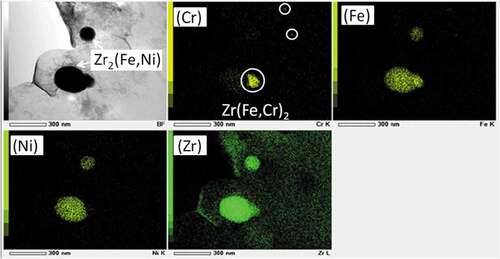
Figure 3. EDS spectrum of (a) Zr(Fe,Cr)2 precipitate and (b) Zr2(Fe,Ni) precipitate before irradiation.
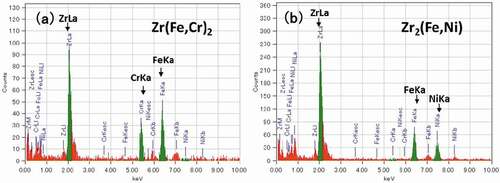
Figure 4. C-TEM images of Zircaloy-2 irradiated with a dose of 30 dpa at 400°C: (a) cross-sectional view of the irradiated region including the specimen surface (lower magnification) and (b) higher magnification images of the peak-damage region.
Figure 5. (a) C-TEM images of c-component dislocation loops (b) and the corresponding HRTEM image of the region shown in (a).
Figure 6. C-TEM images of the samples irradiated with a dose of 30 dpa at 400°C: (a) Zr-1.5Sn alloy and (b) Zr-1.5Sn-0.3Fe alloy.
Figure 7. STEM-EDS analysis of Zircaloy-2 irradiated with a dose of 30 dpa at 400°C: (a) bright-field image, (b) chemical maps extracted from a spectral image, and (c) a line scan of a precipitate.
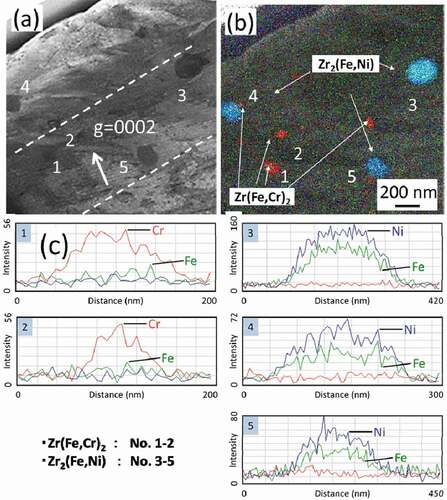
Figure 8. Influence of the dose on elemental content ratios of (a) Zr(Fe,Cr)2 and (b) Zr2(Fe,Ni) precipitates.
Figure 9. STEM-EDS mapping of Zircaloy-2 irradiated with a dose of 50 dpa at 400°C: (a) Cr and Fe map of the irradiated region including the specimen surface (low magnification) and (b) high magnification of Ni and Fe map of the peak-damage region.
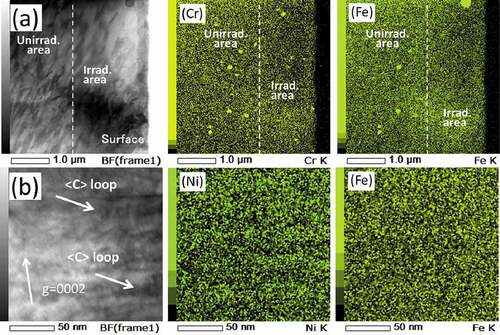
Figure 10. STEM-EDS mapping of Zr-1.5Sn-0.3Fe alloy irradiated with a dose of 30 dpa at 400°C (Fe, Sn, and Zr mapping).
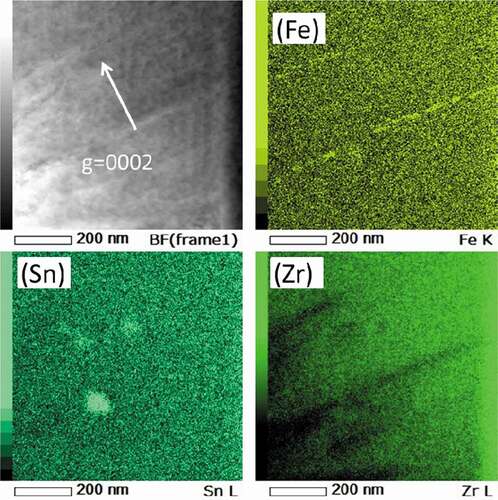
Figure 11. STEM-EDS mapping of Zr-1.5Sn-0.3Fe alloy irradiated with a dose of 30 dpa at 400°C (Fe mapping).
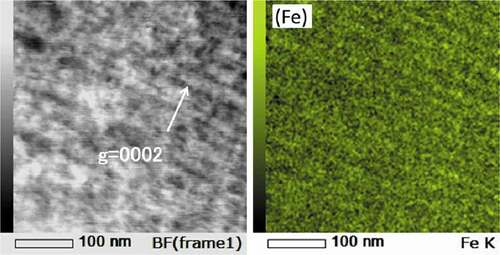
Figure 12. STEM-EDS mapping of Zircaloy-2 irradiated with 300 ppm of injected hydrogen: bright-field and chemical maps extracted from a spectral image of a precipitate.
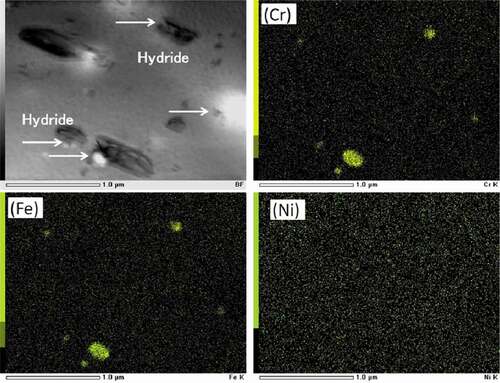
Figure 13. Magnified STEM-BF image of the δ-hydride associated with the Zr(Fe,Cr)2 precipitate.
Figure 14. STEM-BF images of Zircaloy-2: (a) microstructure of an unirradiated region exposed to the same heat conditions at 400°C with a dose of 30 dpa and (b) microstructure of the peak-damage region of the sample irradiated with a dose of 30 dpa at 400°C.
Figure 15. Size distributions of δ-hydride: (a) unirradiated region exposed to the same heat conditions with a dose of 30 dpa at 400°C and (b) the peak-damage region of the sample irradiated with a dose of 30 dpa at 400°C.
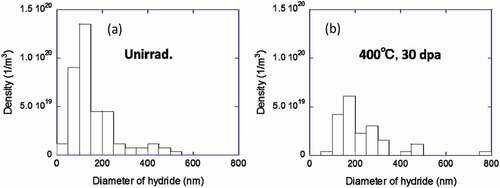
Figure 16. Influence of the annealing temperature on the microstructure in irradiated and unirradiated regions.
Figure 17. Number density of δ-hydrides at different annealing temperatures.
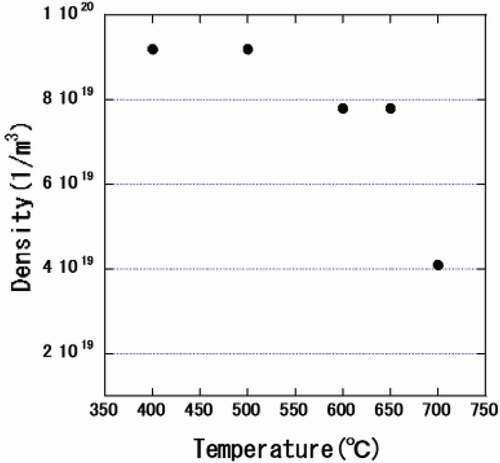
Figure 18. C-TEM images of Zr-1.5Sn-0.3Fe alloy irradiated with a dose of 30 dpa at 400°C: (a) difference from Bragg condition (s) is close to zero and (b) s > 0.
Figure 19. C-TEM images of c-component dislocation loops formed near grain boundary: Zr-1.5Sn-0.3Fe alloy with a dose of 30 dpa at 400°C.
Figure 20. Influence of the dose (30 and 50 dpa) on the region where the c-component dislocation loops formed.