
Figures & data
Figure 1. Top view of the KUCA A-core in Bi sample reactivity worth experiments (Reference core).
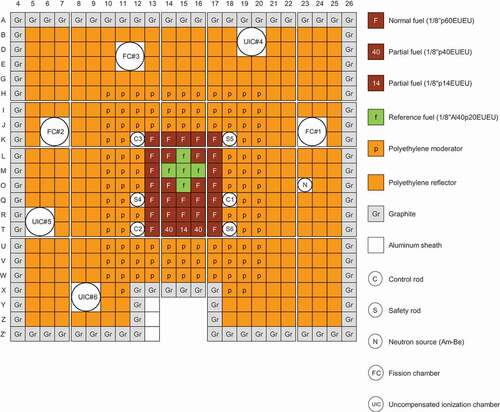
Figure 2. Schematic drawing of fuel assemblies () in the A-core. (a). 1/8”p60EUEU fuel rod; (b). ‘40’ partial fuel rod; (c). ‘14’ partial fuel rod; and (d). Reference fuel rod ‘f’ containing Al plates.
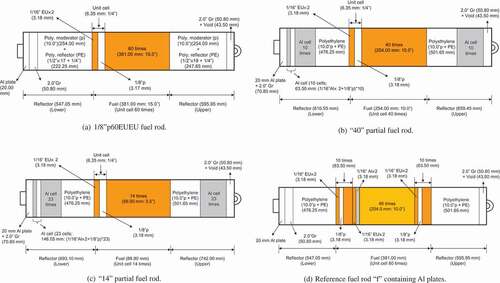
Table 1. Control rod positions at the critical state in reference (Al) and test (Bi) cores shown in and , respectively
Figure 3. Patterns of Bi sample reactivity worth experiments (b: test fuel rod; ). (a) Case 1; (b) Case 2; (c) Case 3; and (d) Case 4.
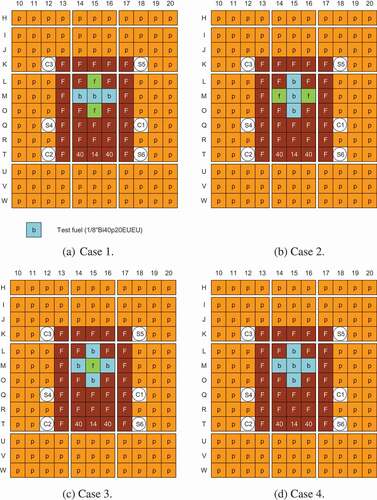
Figure 4. Schematic drawing of test fuel rod containing Bi.
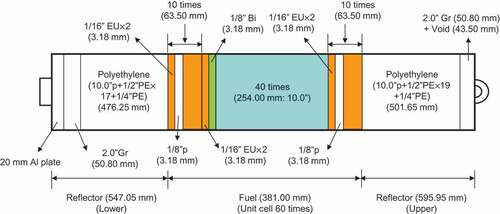
Table 2. Comparison between the results of measured and calculated (EquationEquation (2)(2)
(2) ; MCNP6.1) excess reactivities in reference (Al) and test (Bi) cores shown in and , respectively
Table 3. Comparison between the results of measured and calculated (MCNP6.1) control rod worth in reference core (Al reference core) shown in
Table 4. Comparison of measured and calculated Bi sample reactivity worth in EquationEquations (1)(1)
(1) and (Equation4
(4)
(4) ), respectively, and criticality bias in EquationEquation (5)
(5)
(5)
Figure 5. Comparison between the values of criticality bias at critical state evaluated by EquationEquation (5)(5)
(5) .
Figure 6. Sensitivity coefficients of inelastic scattering reactions of 209Bi and 27Al in JENDL-4.0. (a) 209Bi and (b)27Al.
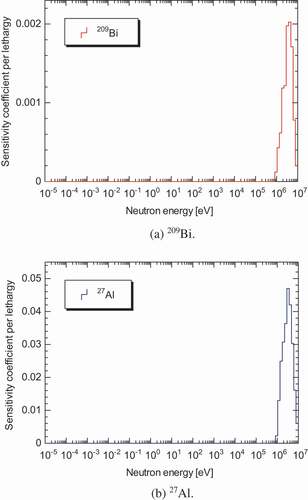
Figure 7. Sensitivity coefficients of elastic scattering reactions of 209Bi and 27Al in JENDL-4.0. (a) 209Bi and (b)27Al.
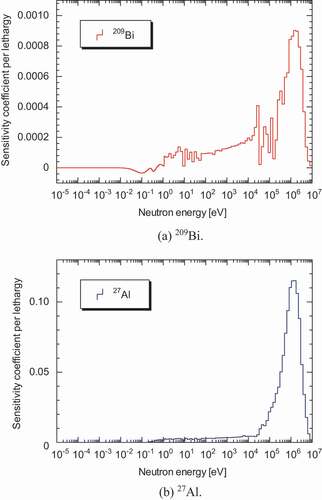
Figure 8. Sensitivity coefficients of capture reactions of 209Bi, 27Al, 235U and 238U in JENDL-4.0. (a) 209Bi and (b) 27Al, 235U and 238U.
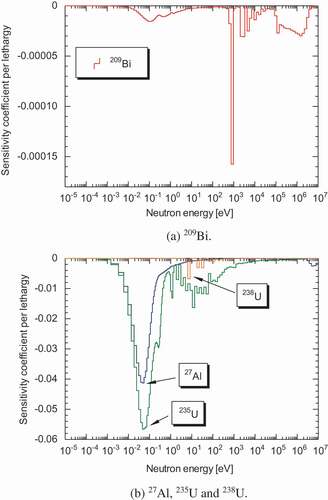
Table 5. Reaction-wise contribution [pcm] to changes in Bi sample reactivity worth (Case 4) induced by covariance data of JENDL-4.0
Table 6. Comparison of the results of measured excess reactivities between Bi and Pb test cores
Table 7. Comparison of reaction-wise contributions [pcm] between Bi and Pb (Ref [Citation14].) sample reactivity worth (Case 4) induced by covariance data of JENDL-4.0