
Figures & data
Figure 1. Illustration of self-leveling behavior.
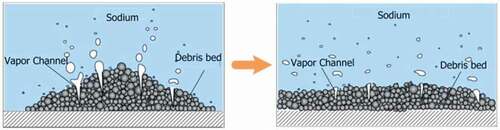
Figure 2. Schematic diagram of experimental setup for self-leveling experiments.
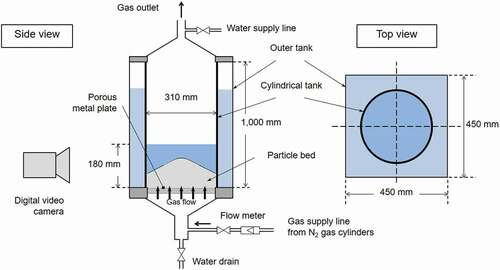
Figure 3. Definition of measured bed mound height.
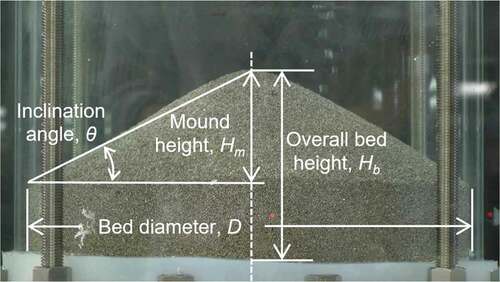
Figure 4. Observed self-leveling behavior of binary-mixed particle bed (Al2O3 (25%) and SS (75%) particles, = 2 mm,
~ 50 L/min,
= 7.0 L,
= 0.31 m).
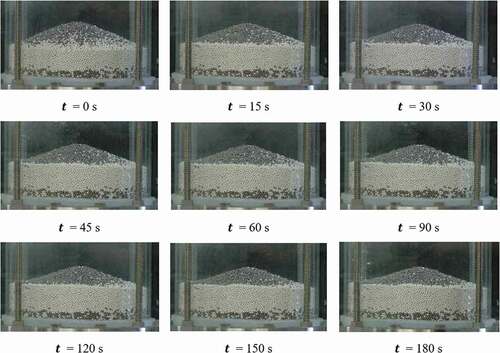
Table 1. Physical properties of particles
Figure 5. Comparison of bed mound variation between intermittent and continuous gas-injection methods ( ~ 46 L/min,
= 7.0 L,
= 0.21 m).
Figure 6. Effect of cylindrical bed diameter on mound height variation ( = 7.0 L).
Figure 7. Effect of particle volume on mound height variation ( = 0.21 m).
Figure 8. Effect of mixing ratio on mound height variation in various particle mixtures ( = 7.0 L,
= 0.31 m).
Table 2. Experimental cases used to determine model parameters
Figure 9. Comparison of model parameters between experiments and predictions.
Figure 10. Comparison of mound height between experiments and empirical model.
Figure 11. Effect of mixing ratio on transient mound height of various binary particle mixtures ( = 7.0 L,
= 0.31 m).
Figure 12. Self-leveling behavior of ternary mixture (spherical SS particles with = 2.00, 4.00, and 6.00 mm;
= 7.0 L;
= 0.31 m).
Table