Figures & data
Figure 1. Schematic of the high-energy fission model of the de-excitation process together with the INC process. Open circles represent the fission chances that determine whether fission occurs in accordance with the fission probability . In this example, fission occurs after emitting three neutrons by evaporation. For simplicity, charged-particle evaporation is omitted.
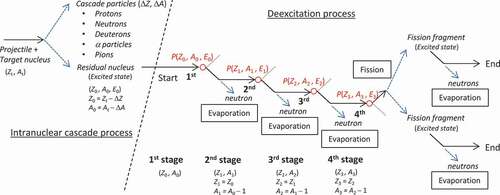
Table 1. Fitting parameters
Figure 2. Total fission probability for Bi(
),
Pb(
),
Au(
),
Ta(
),and
Ho(
) reactions as a function of incident proton energy, calculated with Prokofiev’s fission cross-section systematics and Pearlstein–Niita’s non-elastic cross-section systematics.
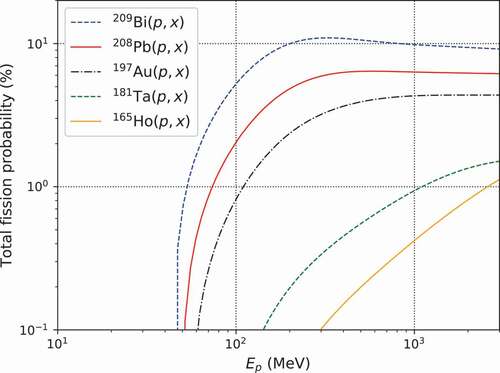
Figure 3. Relationship between the mean excitation energy after the INC process and incident proton energy for proton-induced reactions for Pb and
Ho. Data points and lines indicate the calculation results of INCL4.6 and EquationEquation (7)
(7)
(7) , respectively.
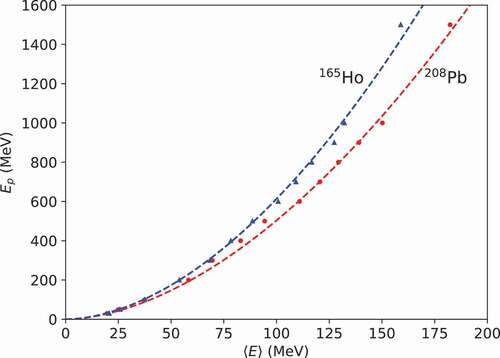
Figure 4. Relationship between the mean reduced and
numbers (
,
) and the mean excitation energy
after the INC process for proton-induced reactions for
Bi,
Pb,
Au,
Ta, and
Ho. Data points and lines indicate the calculation results of INCL4.6 and EquationEquations (10)
(10)
(10) and (Equation11
(11)
(11) ), respectively.
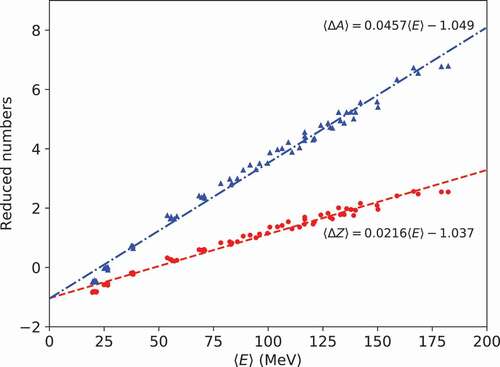
Figure 5. Fission probability for the corresponding mean of (
,
) for
Bi,
Pb,
Au,
Ta, and
Ho as a function of excitation energy.
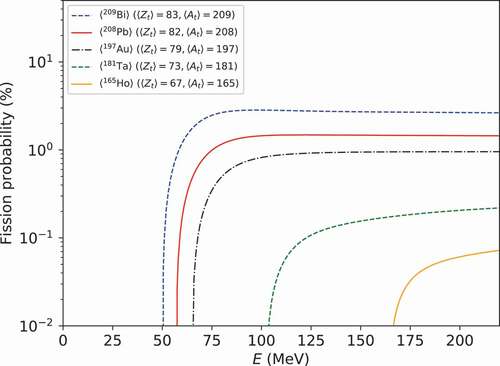
Figure 6. Proton-induced fission cross-sections of Bi,
Pb,
Au,
Ta, and
Ho, as compared with experimental data from Refs [Citation40–Citation60].
![Figure 6. Proton-induced fission cross-sections of 209Bi, 208Pb, 197Au, 181Ta, and 165Ho, as compared with experimental data from Refs [Citation40–Citation60].](/cms/asset/d13af4f2-9a9f-4ae5-84ec-8f695ab1d42f/tnst_a_1539351_f0006_oc.jpg)
Figure 7. Neutron-induced fission cross-sections of Bi,
Pb,
Pb,
Au, and
Ta, as compared with experimental data from Refs [Citation62–Citation65].
![Figure 7. Neutron-induced fission cross-sections of 209Bi, 208Pb, natPb, 197Au, and 181Ta, as compared with experimental data from Refs [Citation62–Citation65].](/cms/asset/b118994c-fe39-49db-b1f1-c8555c37e4a7/tnst_a_1539351_f0007_oc.jpg)
Figure 8. Deuteron-induced fission cross section of Bi and
Pb, compared with experimental data from Refs [Citation42,Citation66–Citation68].
![Figure 8. Deuteron-induced fission cross section of 209Bi and 208Pb, compared with experimental data from Refs [Citation42,Citation66–Citation68].](/cms/asset/38dee856-8dc2-48b7-a33c-e01faf968d95/tnst_a_1539351_f0008_oc.jpg)
Figure 9. Fission cross-section ratios between proton- and neutron-induced fissions for Bi,
Pb,
Au, and
Ta targets calculated with the modified model, as compared with experimental data from [Citation62,Citation69].
![Figure 9. Fission cross-section ratios between proton- and neutron-induced fissions for 209Bi, 208Pb, 197Au, and 181Ta targets calculated with the modified model, as compared with experimental data from [Citation62,Citation69].](/cms/asset/088343ed-a801-4cff-a6be-ce409d9969f9/tnst_a_1539351_f0009_oc.jpg)
Figure 10. Neutron-induced fission cross section ratio between Pb and
Bi, as compared with experimental data from Ref [Citation62].
![Figure 10. Neutron-induced fission cross section ratio between natPb and 209Bi, as compared with experimental data from Ref [Citation62].](/cms/asset/67c41f8c-be8a-417a-a8b1-380175813b0e/tnst_a_1539351_f0010_oc.jpg)
Figure 11. Mass distribution for +
Pb (1000
MeV),
+
Au (800
MeV), and
+
Pb (500
MeV) reactions, as compared with experimental data from Refs [Citation49,Citation52,Citation70].
![Figure 11. Mass distribution for p + 208Pb (1000A MeV), p + 197Au (800A MeV), and p + 208Pb (500A MeV) reactions, as compared with experimental data from Refs [Citation49,Citation52,Citation70].](/cms/asset/e1afbf8a-a78d-4b5a-9c93-b6484bc77307/tnst_a_1539351_f0011_oc.jpg)
Figure 12. distribution as a function of
number for
+
Pb (1000
MeV),
+
Au (800
MeV), and
+
Pb (500
MeV) reactions.
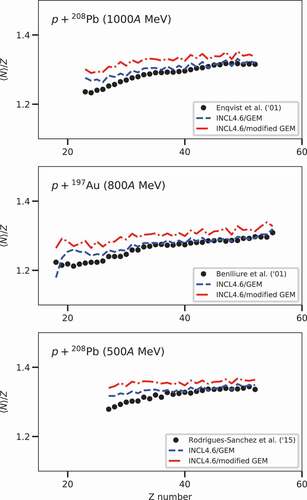
Figure 13. distribution as a function of
number for
+
Pb (1000
MeV),
+
Au (800
MeV), and
+
Pb (500
MeV) reactions.
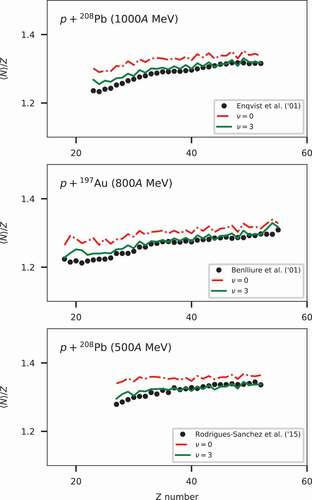
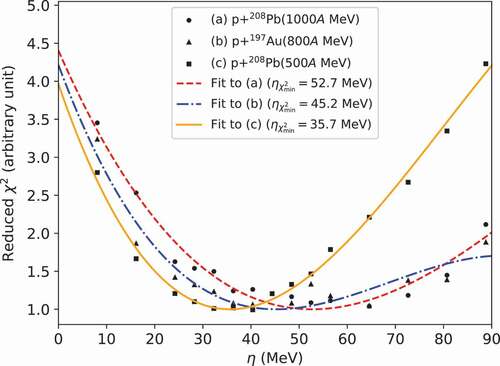
Figure 14. Reduced values as a function of
for
+
Pb (1000
MeV),
+
Au (800
MeV), and
+
Pb (500
MeV) reactions. The values are scaled so that the minimum values of the fitting functions are normalized to unity.