Figures & data
Figure 1. Scanning electron microscopy (SEM) photographs and energy dispersive spectra (EDS) of hyphae developed in agar medium containing 5.0 × 10⁻³ and 1.0 × 10⁻² mol kg−1 Cs for 7 days. Arrows in SEM photographs show the position analyzed by EDS.
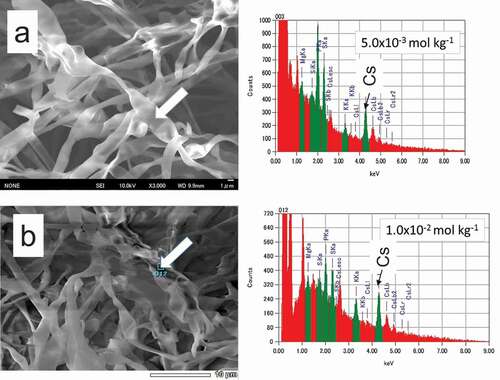
Figure 2. Average radioactivity of 137Cs of SMS and soil placed on the litter under three kinds of different conditions without treatment (No treatment), covered with wood box (With box), and blocked surface water flow by zeolite placed on upper position (With zeolite). Error bar shows standard deviation. Activity of 137Cs in soil and SMS samples are referred by arrows. Bar showed deviation of the activity. Triplicate samples were measured for each condition.
Figure 3. TF of radioactive Cs accumulated in SMS for 2, 4, and 6 months under three kinds of different conditions without treatment (No treatment), covered with wood box (With box), and blocked surface water flow by zeolite placed on upper position (With zeolite). Error bar shows standard deviation of triplicate samples.
Figure 4. Schematic diagram of the pathways of radioactive Cs accumulated in SMS.
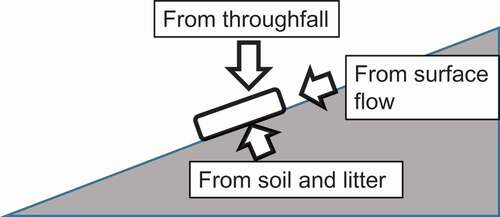
Figure 5. TF of radioactive Cs accumulated in SMS placed on the litter (On litter), after removal of half of litter (Remove half), and after removal of all litter (Remove all).