
Figures & data
Figure 1. Microstructure of SA738Gr.B steel.
Table 1. SAW experiment scheme of SA738Gr.B
Figure 2. Schematic diagram of double-Y groove.
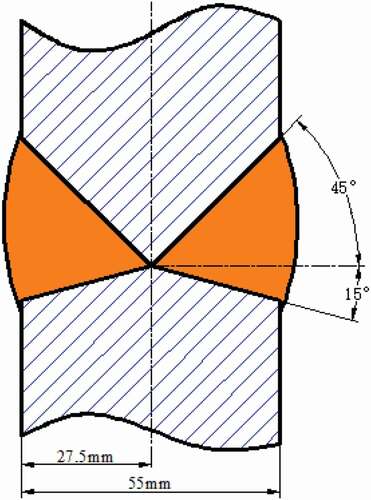
Table 2. Fracture toughness test data
Figure 3. HAZ specimen sampling diagram. (a) Schematic diagram of 0.5T-C(T) specimen sampling in HAZ, (b) Heat-affected zone range metallographic map, (c) Machining groove in HAZ schematic, and (d) HAZ prefabricated fatigue crack specimen.
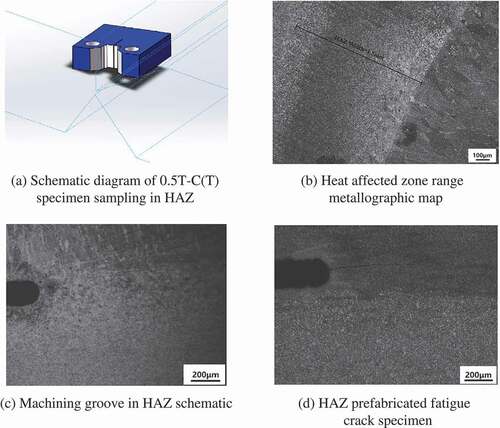
Figure 4. Fracture toughness test environment.
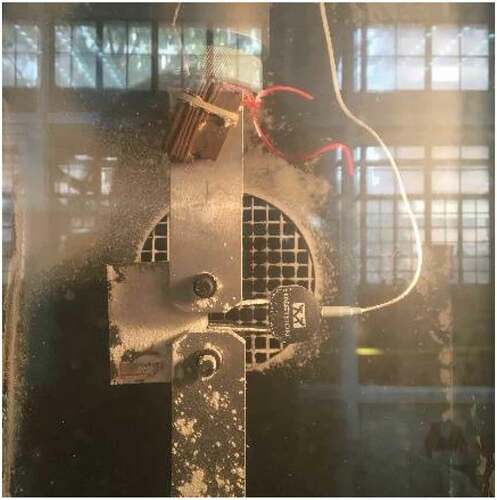
Table 3. Standard MC method to obtain the characteristic parameters
Figure 5. MC method results of SA738Gr.B HAZ. (a) AW and (b) PWHT.
Figure 6. Weibull plots of fracture toughness data (Weibull slop fixed at 4).
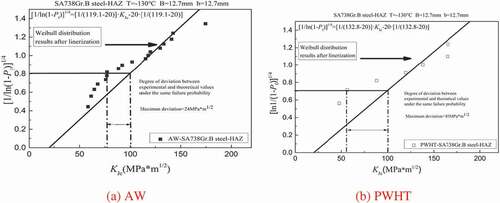
Table 4. BMC method characteristic parameters fitting values
Figure 8. Weibull distribution fitting (Weibull slop fixed at 4). (a) AW and (b) PWHT.
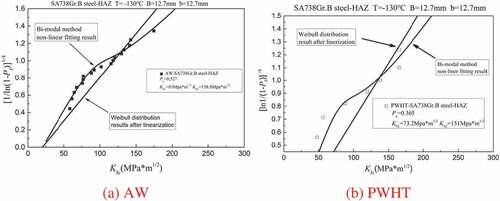
Figure 7. BMC model master curve and its 5% and 95% upper and lower boundary curves.
Figure 9. SPE model master curve and its 5% and 95% upper and lower boundary curves. (a) AW and (b) PWHT.
Table 5. BMC method characteristic parameters fitting values
Table 6. SINTAP inhomogeneity screening results
Figure 10. SINTAP model master curve and its 5% and 95% upper and lower boundary curves.
Table 7. HAZ fracture toughness characteristic parameters