
Figures & data
Table 1. Differential capture and transmission measurements of 243Am
Table 2. Thermal capture cross sections provided by different integral measurements and evaluations of 243Am
Figure 1. Vertical cross sectional view of ANNRI.
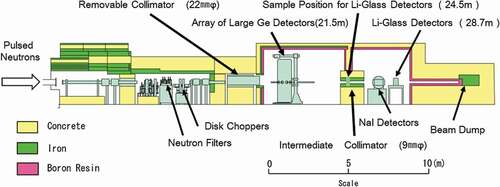
Table 3. Characteristics of the samples
Table 4. Isotopic and impurity abundances of 243Am sample
Table 5. Measuring times
Figure 2. Prompt gamma-ray pulse-height spectra of the 240-MBq 243Am sample, the dummy case, and a decay gamma-ray pulse-height spectrum from the 240-MBq 243Am sample without neutron beam measured with one of the cluster crystals. Each spectrum was normalized with the number of incident proton beam shots.
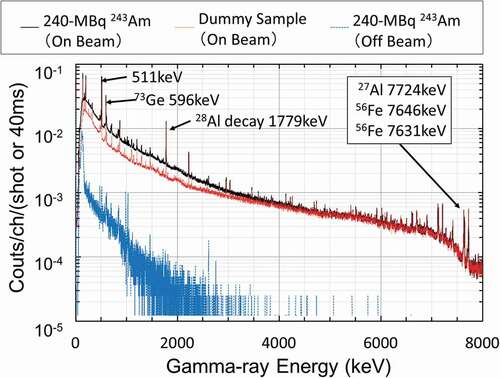
Figure 3. Gated TOF spectra per protons of the 243Am samples and the dummy sample. The spectra were measured with one of the 14 crystals.
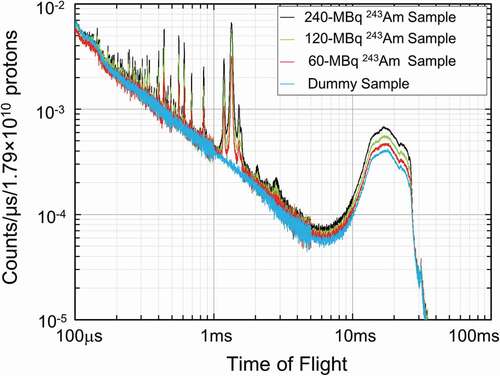
Figure 4. Typical time dependences of the dead-time correction factor for the measurements of the 240-MBq 243Am sample and the 60-MBq 243Am sample.
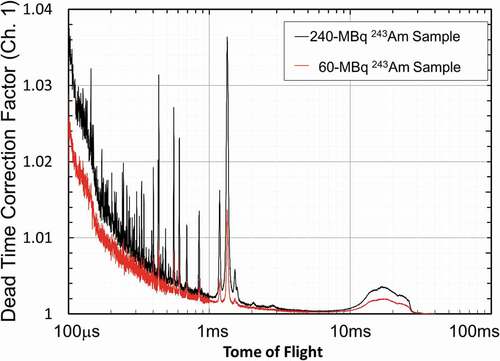
Figure 5. Deduced net spectra of the 240-MBq 243Am sample and that of the 60-MBq 243Am sample.
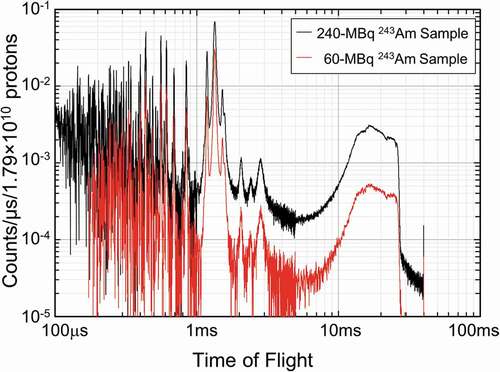
Figure 6. Correction factors for neutron self-shielding and multiple scattering on the 240-MBq 243Am sample and the 60-MBq 243Am sample.
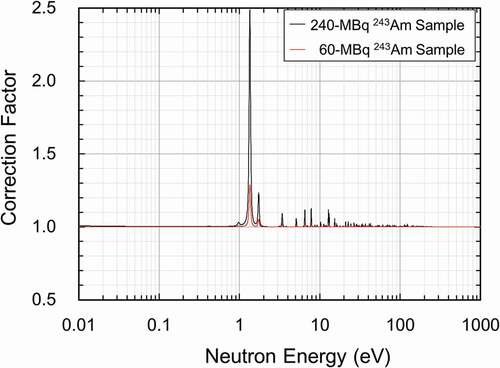
Figure 7. Relative neutron spectrum obtained using the 10B(n,)7Li reactions and uncertainties (total, statistical uncertainty, uncertainty due to self-shielding and multiple-scattering correction).
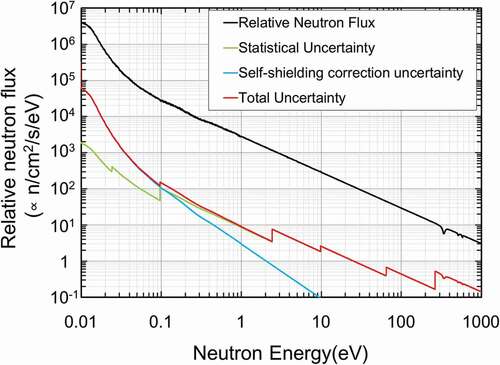
Figure 8. Ratios of the capture yields of the 120-MBq 243Am sample and the 60-MBq 243Am sample to that of the 240-MBq 243Am sample.
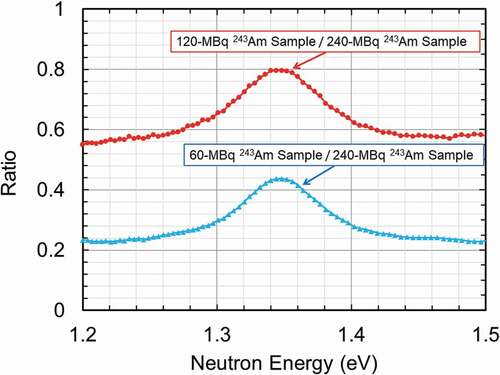
Figure 9. Determined neutron capture cross sections of 243Am around the 1.356 eV resonance together with values of JENDL-4.0 for temperature of 300 K (broadened with the resolution function).
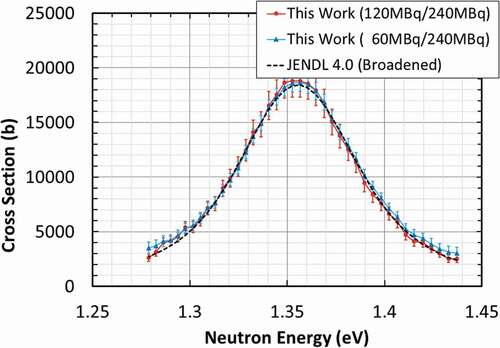
Figure 11. Normalized yield from the measurements of the 243Am samples around 1.356- and 1.744-eV resonances.
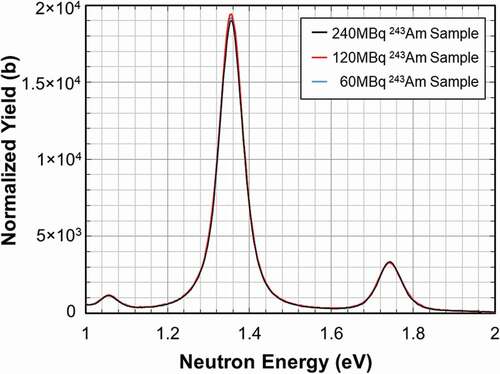
Figure 10. Derived cross section, total uncertainty, statistical uncertainty, uncertainty due to area densities, and uncertainty due to values of evaluated elastic scattering cross section.
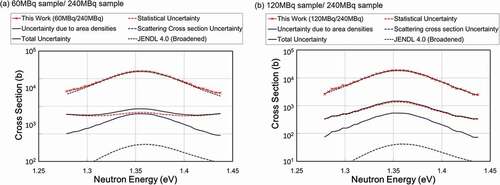
Figure 12. The normalized yields from the measurements of the 240-MBq samples; comparison to the contribution from 243Am and Cm impurities and contribution from deduced impurities of 240Pu and 239Pu. The contributions were calculated using JENDL-4.0.
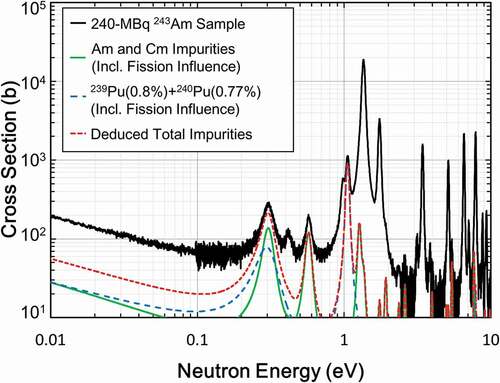
Figure 13. Derived cross section of the 243Am measured with the 60-MBq 243Am sample comparison to the uncertainties of the cross sections (total, statistical uncertainty, uncertainty due to normalization, uncertainty due to dead time correction, uncertainty due to self-shielding and multiple-scattering correction, uncertainty due to neutron flux, uncertainty due to the contribution of fission events, and uncertainty due to impurities).
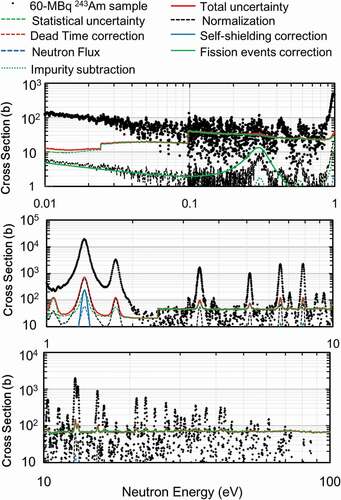
Figure 14. Derived cross section of the 243Am measured with the 120-MBq 243Am sample comparison to the uncertainties of the cross sections (total, statistical uncertainty, uncertainty due to normalization, uncertainty due to dead time correction, uncertainty due to self-shielding and multiple-scattering correction, uncertainty due to neutron flux, uncertainty due to the contribution of fission events, and uncertainty due to impurities).
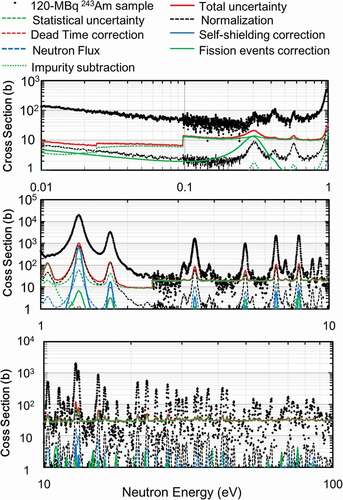
Figure 15. Derived cross section of the 243Am measured with the 240-MBq 243Am sample comparison to the uncertainties of the cross sections (total, statistical uncertainty, uncertainty due to normalization, uncertainty due to dead time correction, uncertainty due to self-shielding and multiple-scattering correction, uncertainty due to neutron flux, uncertainty due to the contribution of fission events, and uncertainty due to impurities).
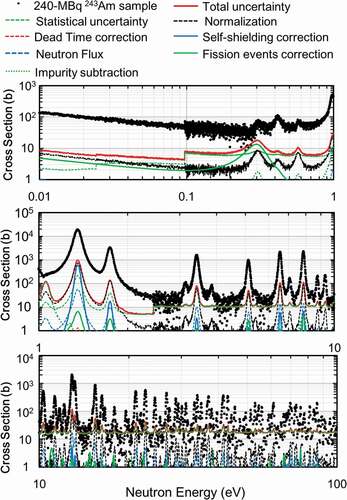
Table 6. Details of uncertainties for the derived capture cross section of 243Am at neutron energy of 0.0253 eV
Figure 16. Obtained neutron capture cross sections of 243Am measured with the 240-MBq 243Am sample and a comparison to evaluated value in JENDL-4.0.
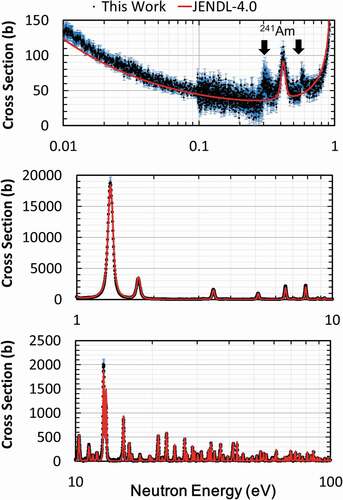
Figure 17. Measured pulse height spectra of the 240-MBq 243Am sample with the 6Li-glass and 7Li-glass scintillation detectors.
Figure 18. Gated TOF spectra of the 240-MBq 243Am sample and the dummy sample with the 6Li-glass scintillation detector and the 7Li-glass scintillation detector. Each TOF spectrum was normalized with the number proton beam shots.
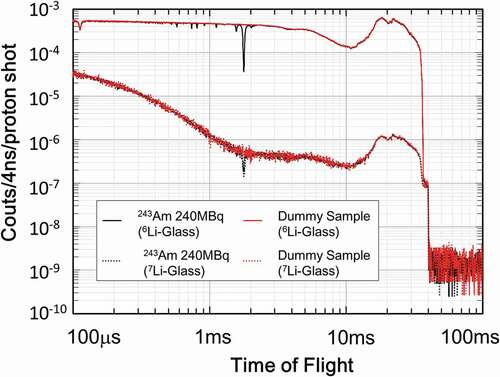
Figure 19. Dead time of the 240-MBq 243Am sample measurements with the 6Li-glass detector and the 7Li-glass detector.
Figure 20. Transmission ratio of the 240-MBq 243Am sample.
Figure 21. Derived total cross section of 243Am, and uncertainties of the cross sections (total, statistical uncertainty, systematic uncertainty, uncertainty due to neutron intensity, and uncertainty due to impurity subtraction).
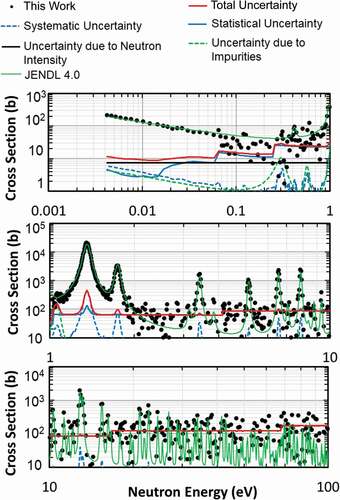
Table 7. Details of uncertainties for the derived total cross section of 243Am at neutron energy of 0.0253 eV