Figures & data
Figure 1. An example of data block that contains the HEAD and TAB1 records defined in ENDF-6. This data block includes two CONT records, arrays of integer and floating-point numbers. indicates there are a pair of integer data, and
means there are five
pairs.
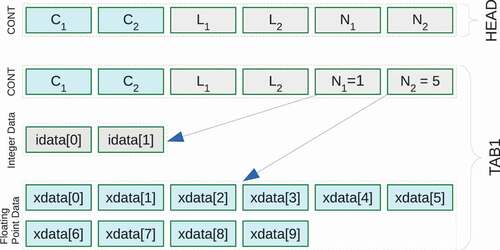
Figure 2. An integer pointer and a floating-point pointer to store arbitrary number of data in one-dimensional buffers. The last pointers point just one element outside the stored data.
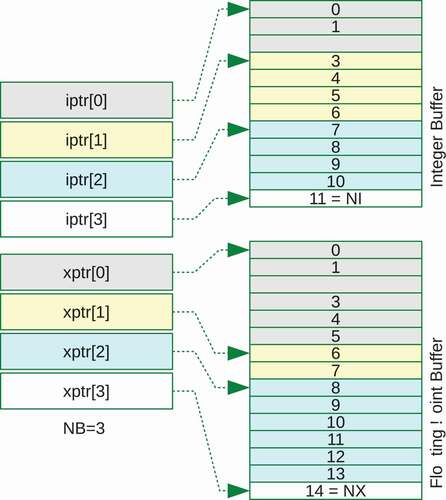
Figure 3. The schematic illustration of DeCE that uses the ENDFLIB and ENDFIO libraries as an interface between an ENDF-6 file and an ENDF object.
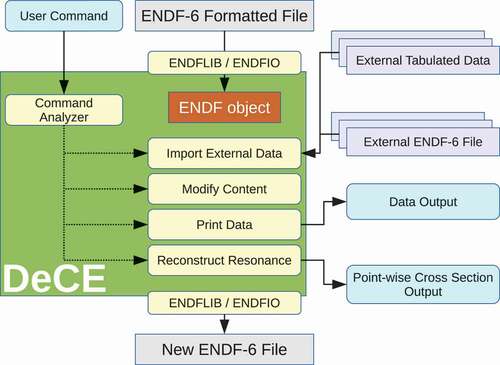
Figure 4. Reconstructed point-wise cross sections of Ni with DeCE. The solid curve is the total cross section and the dashed curve is the capture cross-section.
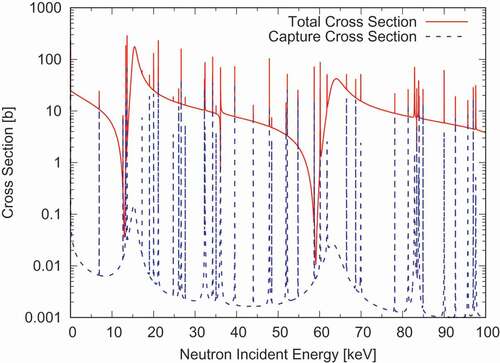
Figure 5. Calculated Legendre coefficients for neutron elastic scattering of Ni. The solid curve is for the
component, and the dashed curve is for
.
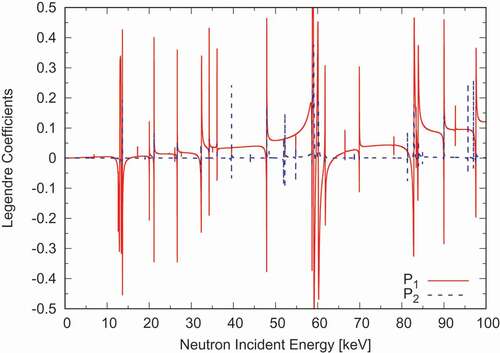
Figure 6. Fluctuation in the elastic scattering cross section introduced by the experimental total cross section of Ni in the 1–1.5 MeV range. DeCE re-distributes the fluctuation on the optical-model calculated smoothed cross section shown by the dashed line.
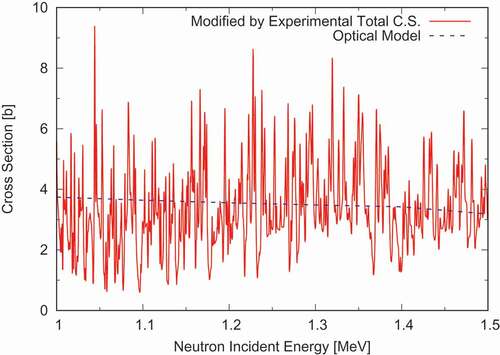
Figure 7. Elastic scattering angular distribution of deuteron, reconstructed from the elastic scattering cross section in and the Legendre coefficients in
.
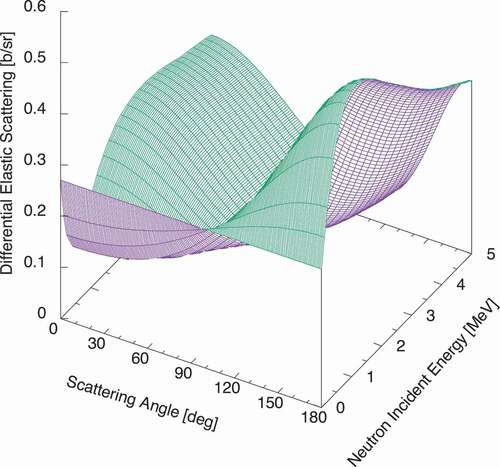
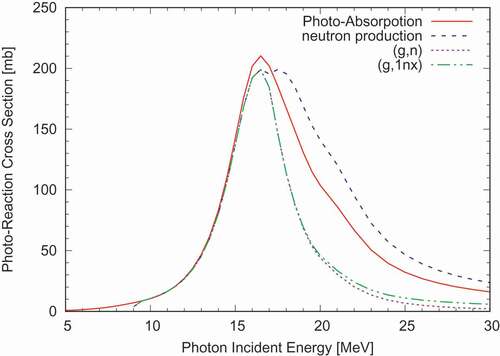
Figure 8. Photo-nuclear reaction cross section of Nb in JENDL/PD-2016. Only the photo-absorption cross-section, shown by the solid line, is explicitly given in the photo-nuclear data library.