
Figures & data
Figure 1. Description of 1/8″P60EUEU fuel assembly
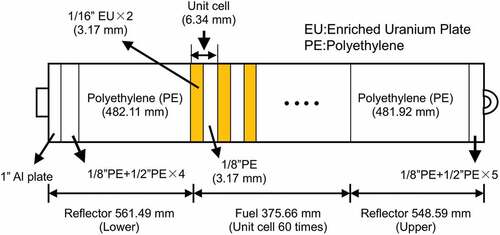
Figure 2. Top view of A-core configuration and neutron detector location
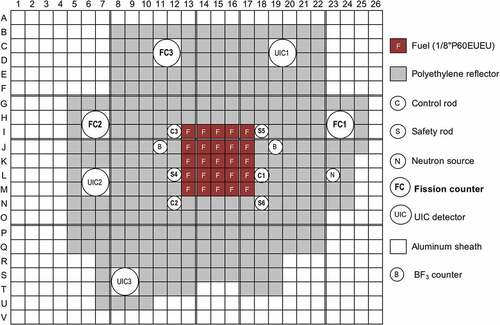
Figure 3. Schematic view of emergency shutdown system
Figure 4. Description of 7/4″G1/4″P8EUNU fuel assembly
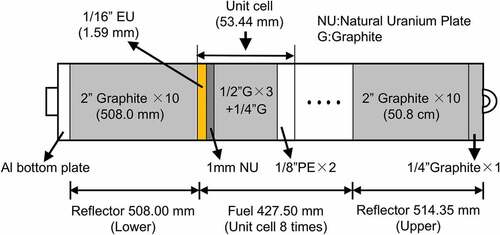
Figure 5. Description of 3/8″ P38EU (driver) fuel assembly
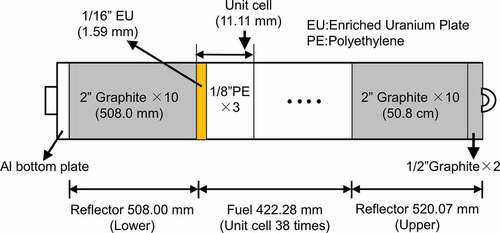
Figure 6. Top view of B-core configuration and neutron detector location
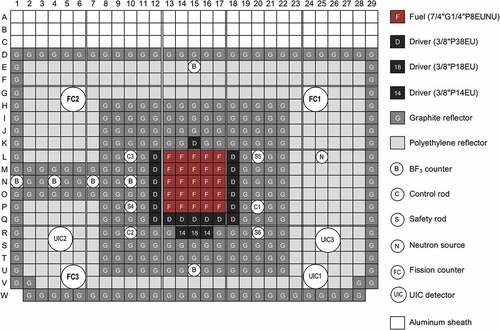
Table 1. Delayed neutron data and generation time of the present reactor systems
Figure 7. N and Q decay behavior with withdrawal of central fuel loading in A-core
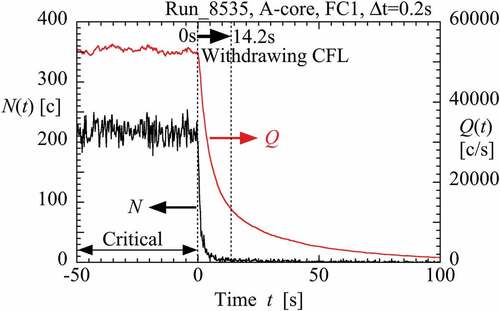
Figure 8. N and Q decay behavior with withdrawal of central fuel loading in B-core
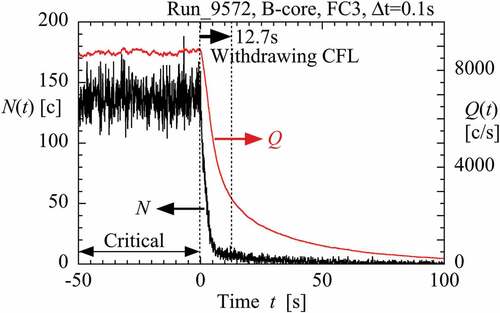
Figure 9. Transient reactivity behavior obtained by conventional inverse kinetics analysis
Figure 10. Plot of variables and fitted line on X-Y coordinate for A-core
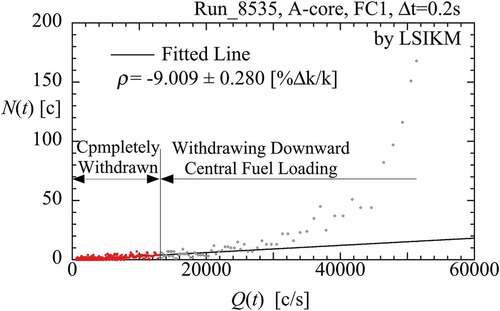
Figure 11. Difference of N between FC1 and FC3 under withdrawing central fuel loading
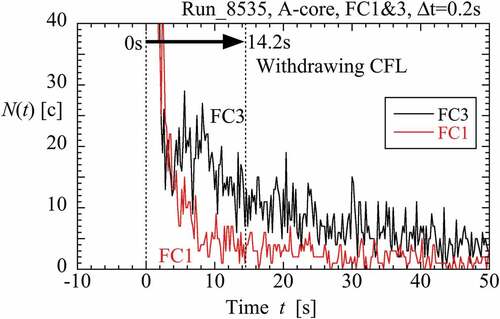
Figure 12. Plot of variables and fitted line on X-Y coordinate for B-core
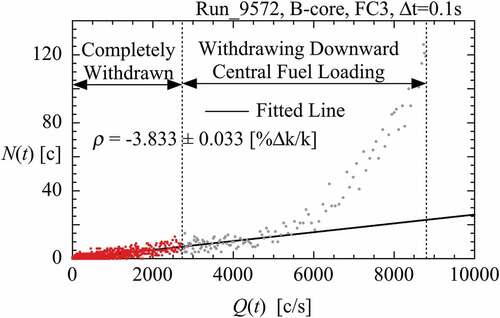
Table 2. Reactivity worth of central fuel loading obtained by the integral count technique [%▵k/k]
Table 3. Reactivity worth of central fuel loading obtained by the least-squares inverse kinetics method [%▵k/k]