Figures & data
Figure 1. Horizontal and vertical plane views of KARTINI Reactor
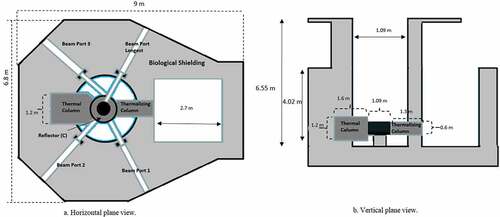
Table 1. Clearance levels of some important radionuclides [Citation9]
Figure 2. Flow of calculations
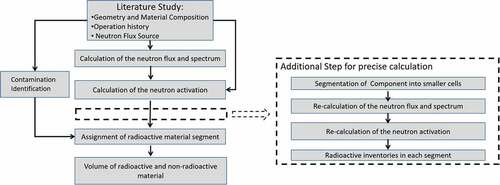
Table 2. Material compositions in weight percentage
Figure 3. Simplified scheme of operation history used in this calculation as the basic case
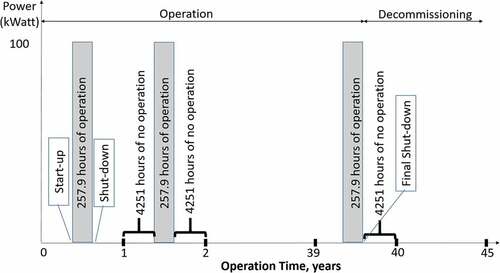
Table 3. Distribution of neutron flux (n/cm2.s) [Citation11]
Figure 4. Neutron flux distribution [Citation11]
![Figure 4. Neutron flux distribution [Citation11]](/cms/asset/dd35d2ad-98f9-47c3-9eb6-452cc7e01209/tnst_a_1667923_f0004_c.jpg)
Table 4. Radioactive inventories and D/C in components 5 years after reactor shutdown
Figure 5. Distribution of Σ D/C in biological shielding segments
Figure 6. Operation history assumption
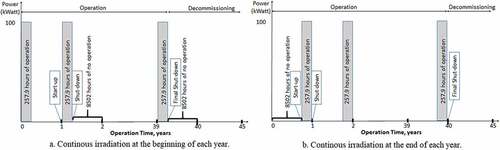
Table 5. Σ D/C calculated using lower (a) and higher (b) case of operation history
Table 6. Σ D/C calculated using lower and higher impurities
Table 7. Weight of radioactive wastes at 5 years after reactor shutdown
Figure 7. Horizontal and vertical plane view of KARTINI reactor showing area of categorization
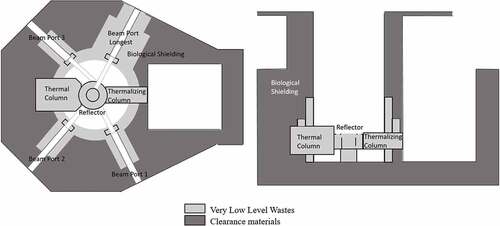
Figure 8. Radioactive concrete waste distribution map according to simple dismantling cutting line
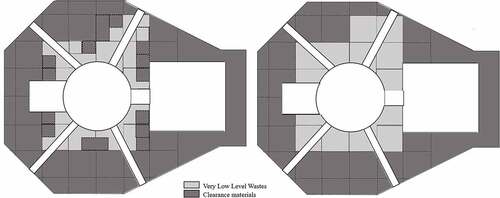
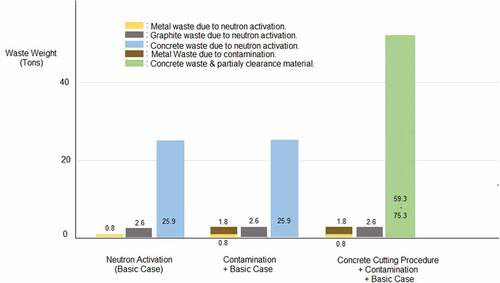
Figure 9. Summary of radioactive waste weight at 5 years after reactor shutdown