Figures & data
Figure 1. Comparison of DDX for (800 MeV) +
Pb reaction between the PHITS calculations and experimental data
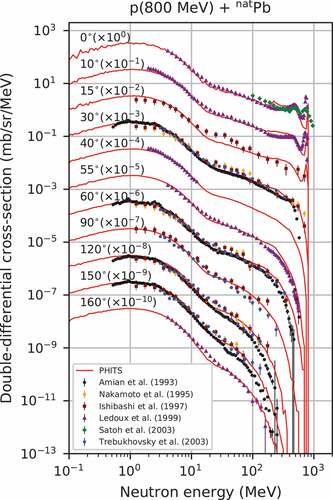
Figure 2. Histograms of relative difference from the PHITS calculation of DDXs for 20, 34, 48, 62.9, 63, 78, 113, 256, 597, and 800 MeV, as well as 1.0, 1.2, 1.5, 1.6, and 3.0 GeV +
Pb reactions, where the values in each bin are normalized such that the integral value is unity. In each panel, the datapoint with the error bar indicates
and uncertainty width
of the distribution
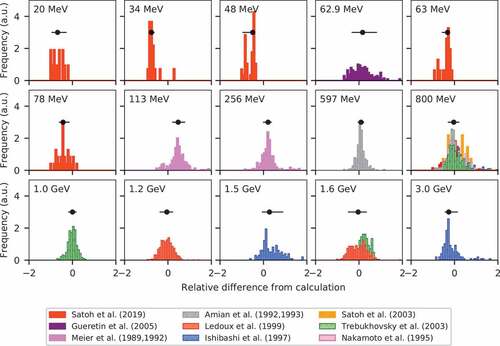
Table 1. Summary of DDX experiments for Pb
reactions and evaluation results for each incident proton energy
Figure 3. Proton-induced natPb spallation neutron multiplicity (top panel: linear scale, bottom panel: logarithmic scale). The dot-dashed lines are the calculations with PHITS. The solid line is the JENDL-4.0/HE evaluation; the dotted line is the TENDL-2017 evaluation; the datapoints with error bars indicate
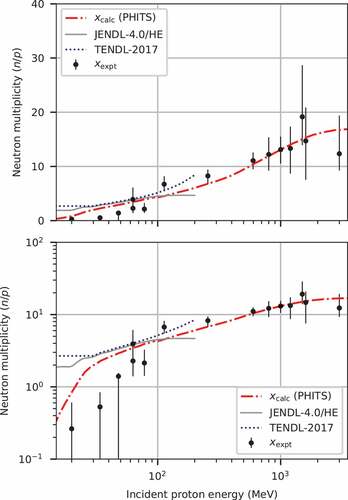
Figure 4. Histogram of relative difference from the PHITS calculations for incident proton energies above 100 MeV. The dashed and solid curves indicate a fit to the histogram with Gaussian distribution and Student’s t-distribution, respectively (top panel: linear scale, bottom panel: logarithmic scale)
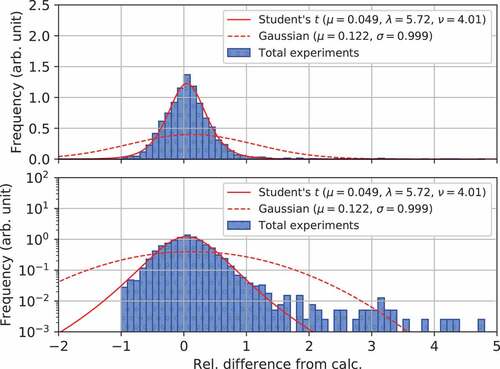
Figure 5. Histogram of relative difference from EquationEquation.(12)(12)
(12) for incident energies below 100 MeV (top panel: linear scale, bottom panel: logarithmic scale)
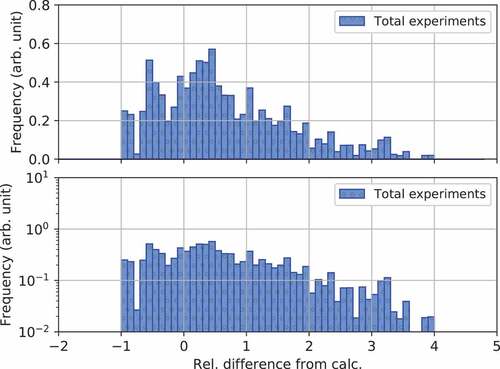
Figure 6. Same as , but including the uncertainty estimated from ,
, and
(top panel: linear scale, bottom panel: logarithmic scale). The dotted lines and the dark and light bands are
and 50% and 90% UIs, respectively
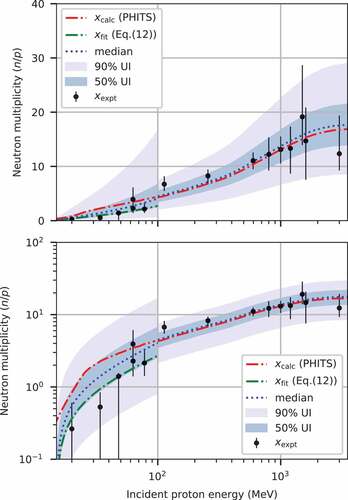
Table 2. Summary of statistical analyses for samples of (
MeV) and
(
MeV)
Figure 7. Neutron-induced spallation proton multiplicity () (left panels), proton-induced spallation proton multiplicity (
) (middle panels), and neutron-induced spallation proton multiplicity (
) (right panels) inferred from the estimated
uncertainty and the PHITS nuclear reaction calculations (top panels: linear scale, bottom panels: logarithmic scale). The dark and light bands are 50% and 90% UIs, respectively
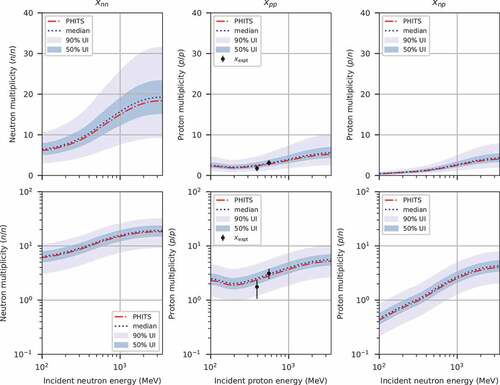
Table 3. Summary of DDX experiments for Pb
reactions and evaluation results for each incident energy
Table 4. Estimates of ,
,
, and
for
Pb at representative incident energies
Figure 8. Responses of random samples to
and
for the 800 MeV proton +
Pb reaction (top panel: histogram of the
random samples, right panel: histogram of the
and
output values, middle panel: relationship between
and
[
]). The datapoints with error bars are the calculation values with 1
statistical uncertainties; the solid line is the least-squares linear fit for a set of the points with error bars. The sample size is 300
![Figure 8. Responses of xrel random samples to σpn and σpp for the 800 MeV proton + natPb reaction (top panel: histogram of the xrel random samples, right panel: histogram of the σpn and σpp output values, middle panel: relationship between xrel and σpn [σpp]). The datapoints with error bars are the calculation values with 1σ statistical uncertainties; the solid line is the least-squares linear fit for a set of the points with error bars. The sample size is 300](/cms/asset/e87a8685-282c-43bd-ba92-5e0e5a7c3f3b/tnst_a_1671912_f0008_oc.jpg)
Figure 9. A schematic of the experimental condition [Citation55]
![Figure 9. A schematic of the experimental condition [Citation55]](/cms/asset/7f965007-7c60-4363-9600-f08e38514bbc/tnst_a_1671912_f0009_oc.jpg)
Table 5. Energy group structure for tally
Figure 10. Convergence of (left panels) and their 1
-equivalent uncertainties (right panels) as a function of the sample size (
) for the detector angle of 30
. For the left panels, the dots with error bars indicate the calculated
samples, the solid line is median of the
sample distributions, and the dashed line is a reference calculated without random sampling. For the right panels, the dashed line indicates
, which is the 1
statistical uncertainty of
averaged over
samples; the dot-dashed line is
, which is the observed statistical uncertainty obtained from
PHITS runs; the solid line is
, which is the uncertainty due to
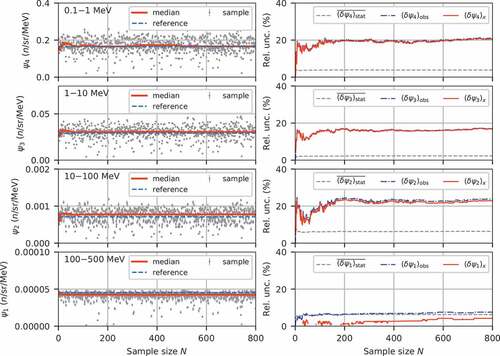
Figure 11. Estimated along with experimental data, which is drawn using the logarithmic scale. The dark and light bands indicate 90% and 50% UIs, respectively, propagated from the estimated
uncertainty above 100 MeV
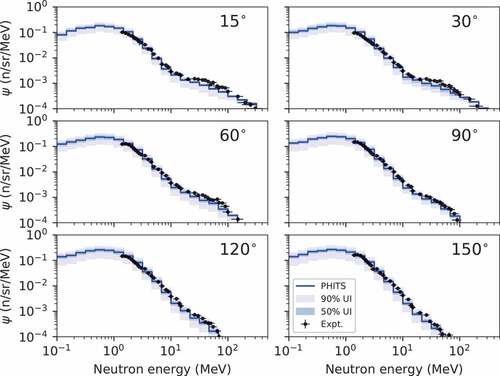
Figure 12. Same as , but drawn with the linear scale
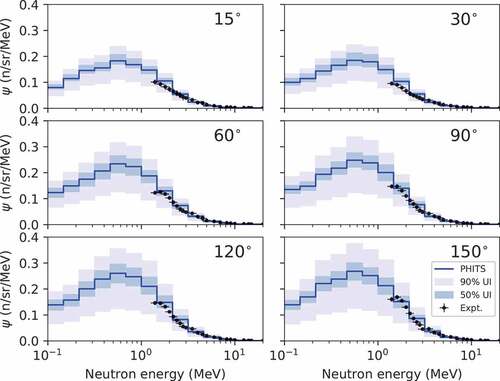
Figure 13. Relationships between random samples and
(
) for the six detector angles in the sampling energy range from 100 to 500 MeV. For each panel, the datapoints with error bars indicate the calculation values with 1
statistical uncertainties; the solid line is the least-squares linear fit for a set of points with the error bars; the dashed line with the dark and light bands indicates
with observed 50% and 90% UIs of
, respectively. The sample size is 200
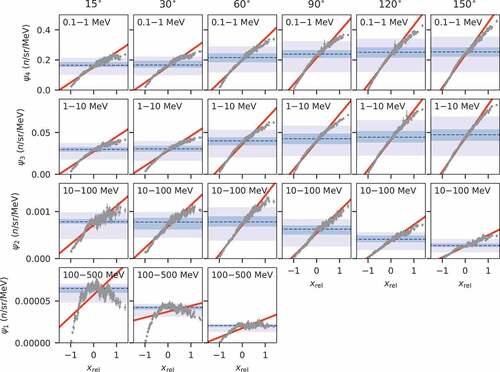
Figure 14. Response of random samples to
(top panel: histogram of the
random samples, right panel: histogram of the
output values, middle panel: relationship between
and
). The datapoints with error bars are the calculation values with 1
statistical uncertainties; the solid line is the least-squares linear fit for a set of points with error bars. The sample size is 800
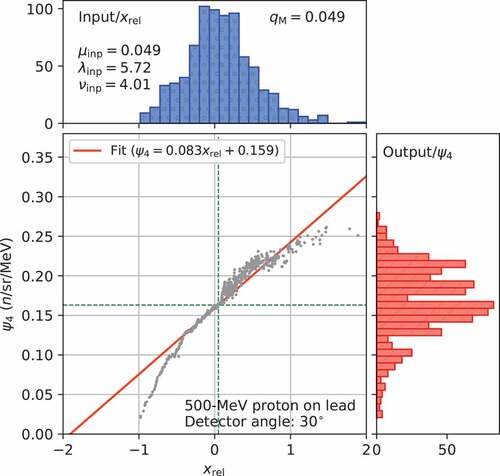
Table 6. Energy group structure for random sampling
Figure 15. Energy breakdown of the response of random samples to
for the 30
detector angle
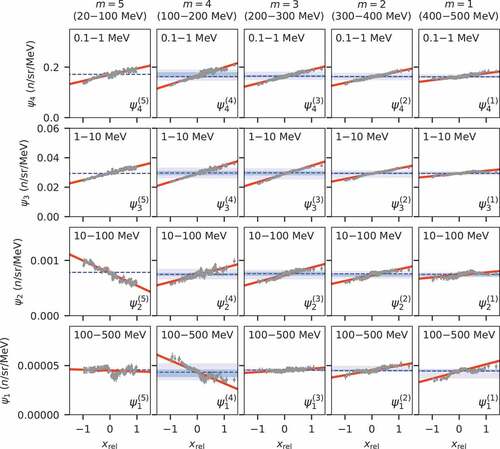
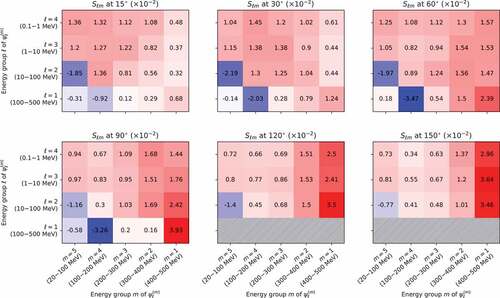
Figure 16. Relative sensitivity matrix of to
for each detector angle