Figures & data
Table 1. Test samples
Table 2. Hydrogen contents and values of Flθ/A for the samples along with the UTS and circumferential permanent strains to failure obtained from the tube burst tests described in Section 2.3
Figure 1. Transverse metallographs of (a) KY87 (as irradiated), (b) KY90 (HCRT-3 days), (c) KY94 (HCRT-9 days), and (d) KY92 (HCRT-21 days). The cross sections of each sample were etched with a solution of HF, HNO3 and H2O2 in a volume ratio of 0.8:3.0:40.0
Figure 2. Schematic of the image analysis for obtaining length and radial orientation of each hydride. The rectangular target domain does not include the Zr liner region nor the interface between the Zr liner and Zircaloy-2 region
Figure 3. Schematic of the tube-burst test device
Figure 4. Circumferential stress-strain curves obtained from the tube burst tests. The circumferential strains displayed were calculated as diameter increments at the longitudinal center of the samples during the test, and this calculation differs from that of the circumferential permanent strains to failure displayed in
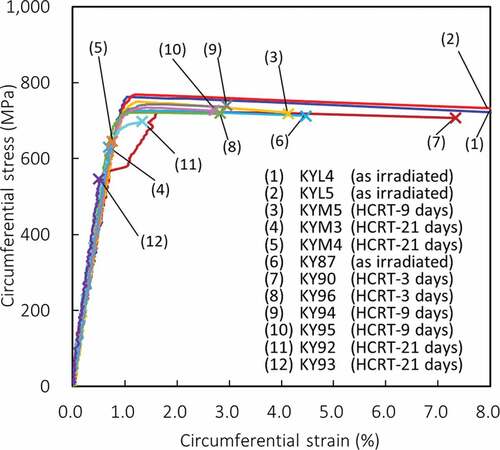
Figure 5. Circumferential UTS against Flθ/A
Figure 6. Permanent circumferential strain to failure against Flθ/A
Figure 7. Post-test photographs of (a) KY87 (as irradiated), (b) KY90 (HCRT-3 days), (c) KY94 (HCRT-9 days), and (d) KY92 (HCRT-21 days). Percentages in the lower right of each image indicate the circumferential permanent strain to failure
Figure 8. Post-test transverse metallographs of (a) KY87 (as irradiated), (b) KY90 (HCRT-3 days), and (c) KY94 (HCRT-9 days). Percentages in the lower right of each image indicate the circumferential permanent strain to failure
Figure 9. SEM fractographs of (a) KY87 (as irradiated), (b) KY90 (HCRT-3 days), and (c) KY94 (HCRT-9 days). Percentages in the lower right of each image indicate the circumferential permanent strain to failure
Figure 10. Post-test transverse metallographs of the samples subjected to HCRT for 21 days; (a) KY92, (b) KY93, (c) KYM3, and (d) KYM4. Percentages in the lower right of each image indicate circumferential permanent strain to failure
Figure 11. SEM fractographs of the samples subjected to HCRT for 21 days; (a) KY93 and (b) KYM3. Percentages in the lower right of each image indicate the circumferential permanent strain to failure