
Figures & data
Figure 1. A chain of detailed individual phenomena related to the formation and cooling of debris.
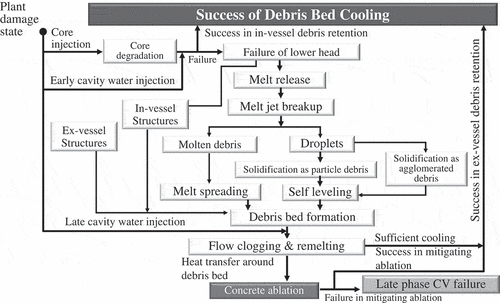
Table 1. Important phenomena relevant to the formation and cooling of debris beds, test data and validation plan of THERMOS.
Figure 2. A structure of THERMOS composed of four modules.
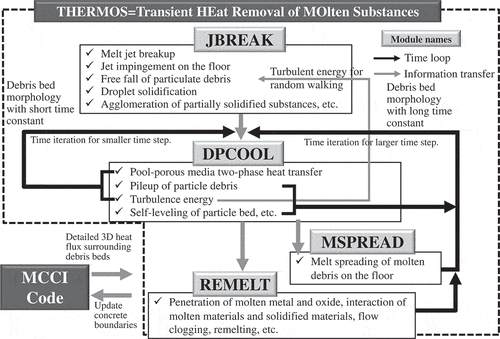
Figure 3. Schematic view of three facilities in the KTH test series.
DEFORA [Citation9]
PULiMS [Citation9]
REMCOD-1 and 2 [Citation11–Citation13]
![Figure 3. Schematic view of three facilities in the KTH test series. DEFORA [Citation9]PULiMS [Citation9]REMCOD-1 and 2 [Citation11–Citation13]](/cms/asset/c6def120-69e0-43d6-8e9a-7ea111ef3975/tnst_a_1691078_f0003_oc.jpg)
Table 2. Schedule of experimental and analytical investigation of the formation and cooling phenomena of high-temperature debris bed [Citation9–Citation13].
Figure 4. Representative data of the DEFOR-A test.
Agglomerated debris data [Citation11–Citation13], [Citation23], [Citation61]
Laser scanning image of captured debris (A27) [Citation13]
![Figure 4. Representative data of the DEFOR-A test. Agglomerated debris data [Citation11–Citation13], [Citation23], [Citation61]Laser scanning image of captured debris (A27) [Citation13]](/cms/asset/a69b04fa-adfe-418c-bcb3-2f8f86dcbeb2/tnst_a_1691078_f0004_c.jpg)
Table 3. Test matrix of DEFOR-A [Citation11–Citation13].
Table 4. Test matrix of PULiMS [Citation10–Citation13].
Figure 5. Representative data of the PULiMS test.
Comparison of spreading front positions measured by video analysis [Citation12,Citation13]
End state of E10 [Citation12]
Post examination of E10 [Citation12]
Post examination of E13 [Citation12]
![Figure 5. Representative data of the PULiMS test. Comparison of spreading front positions measured by video analysis [Citation12,Citation13]End state of E10 [Citation12]Post examination of E10 [Citation12]Post examination of E13 [Citation12]](/cms/asset/755b5ac1-fa90-4dab-8475-a5eaf51dc159/tnst_a_1691078_f0005_c.jpg)
Figure 6. Melt-coolant interactions observed in PULiMS.
E7 [Citation10]
E15 [Citation12]
E17 [Citation13]
![Figure 6. Melt-coolant interactions observed in PULiMS. E7 [Citation10]E15 [Citation12]E17 [Citation13]](/cms/asset/996fc298-1a83-44b3-a744-675ee25390d1/tnst_a_1691078_f0006_c.jpg)
Table 5. Test matrix of REMCOD-1 and 2 [Citation11–Citation13].
Figure 7. Representative data of the REMCOD test.
End state of E11 [Citation12]
Penetration histories in E11 [Citation12]
Penetration vs bed temperature in E08 [Citation12]
Melt retention vs porosity in E09/E11 [Citation12]
![Figure 7. Representative data of the REMCOD test. End state of E11 [Citation12]Penetration histories in E11 [Citation12]Penetration vs bed temperature in E08 [Citation12]Melt retention vs porosity in E09/E11 [Citation12]](/cms/asset/901c7e81-dc84-4962-b90f-1d1aa59c6d0d/tnst_a_1691078_f0007_c.jpg)