Figures & data
Table 1. List of the monitoring stations and the estimation methods applied to them. H is by the hybrid method of the present study and T by the method of Terasaka et al. [Citation13].
Figure 1. Locations of the estimated monitoring stations, numbered as in . The two monitoring stations Kume (K) and Nemoto (N) referred to their dose rate records and the two meteorological stations Hitachi (H) and Mito (M) operated by Japan Meteorological Agency are also shown.
Table 2. The setting of the bins and the values of factor Γ determined by calculation with the EGS5 code. The values of Γ less than 10−7 cps (Bq m−3)−1 are expressed as zero.
Figure 2. Comparison of atmospheric concentrations of the five radionuclides at Muramatsu estimated by the hybrid method (solid circles) and by the method of Terasaka et al. [Citation13] (open circles) with the measured concentrations by Ohkura et al. [Citation1] (solid squares).
![Figure 2. Comparison of atmospheric concentrations of the five radionuclides at Muramatsu estimated by the hybrid method (solid circles) and by the method of Terasaka et al. [Citation13] (open circles) with the measured concentrations by Ohkura et al. [Citation1] (solid squares).](/cms/asset/8f7e87e4-a3c1-4643-942d-3a865a050eb9/tnst_a_1699191_f0002_oc.jpg)
Figure 3. Temporal variations in the estimated atmospheric Xe-133 activity concentrations. The mark (T) following MS name in the legends denotes the results of Terasaka et al. [Citation13].
![Figure 3. Temporal variations in the estimated atmospheric Xe-133 activity concentrations. The mark (T) following MS name in the legends denotes the results of Terasaka et al. [Citation13].](/cms/asset/fa62e1c3-22e5-425b-aa13-6d7ba152ef97/tnst_a_1699191_f0003_c.jpg)
Figure 4. Same as but for Te-132.
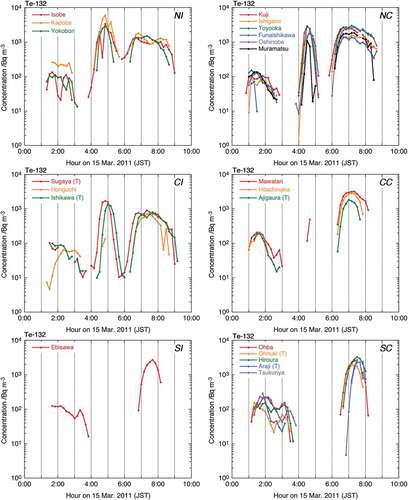
Figure 5. Same as but for I-131.
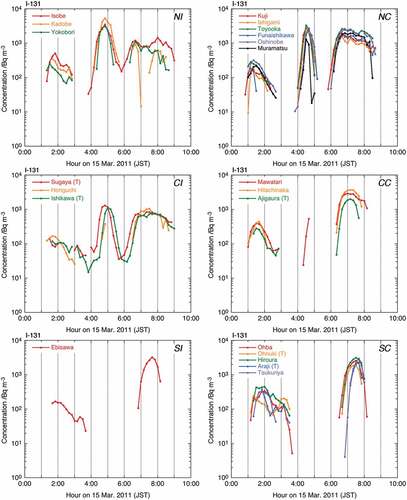
Table 3. The highest concentrations of the nuclides in each plume. Bold figures are maxima among the monitoring stations. The mark (T) following monitoring stations name means the estimation by Terasaka et al. [Citation13].
Figure 6. The spatial distribution of atmospheric concentrations of Xe-133, Te-132 and I-131 in Plume P2A.
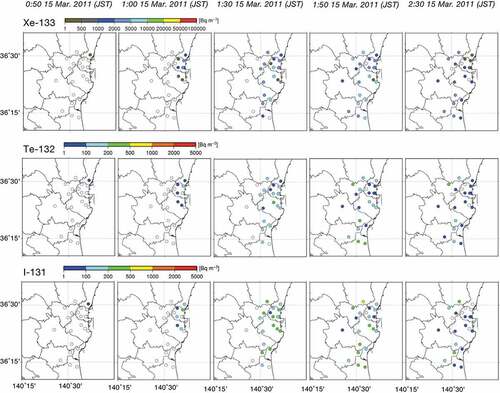
Figure 7. Same as but in Plume P2B.
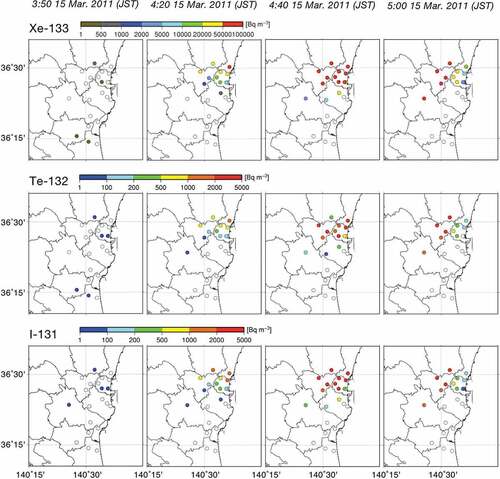
Figure 8. Same as but in Plume P2C.
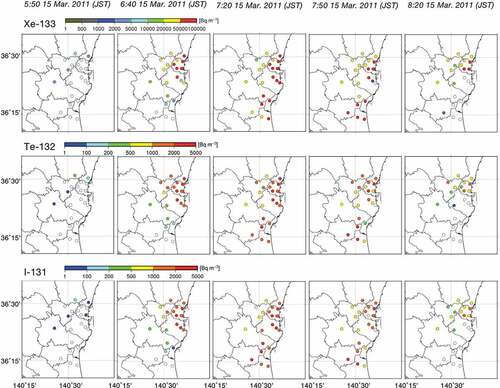
Table 4. The activity ratios calculated from time-averaged concentrations for each plume.
Figure 9. Temporal variations in the 10-min activity ratio of Xe-133/I-131. The mark (T) following each monitoring station name in the legends means calculations from the results of Terasaka et al. [Citation13].
![Figure 9. Temporal variations in the 10-min activity ratio of Xe-133/I-131. The mark (T) following each monitoring station name in the legends means calculations from the results of Terasaka et al. [Citation13].](/cms/asset/cc68dfd7-414e-4ad7-9670-4399258fa4e5/tnst_a_1699191_f0009_c.jpg)
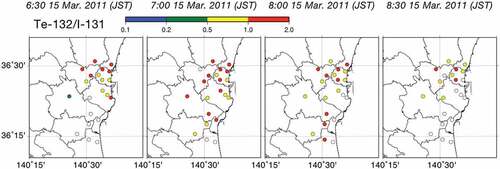
Figure 10. Same as but of Te-132/I-131.
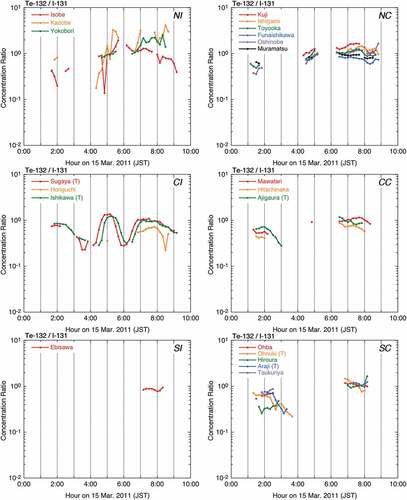
Figure 11. The spatial distribution of Xe-133/I-131 and Te-132/I-131 in Plume P2A.
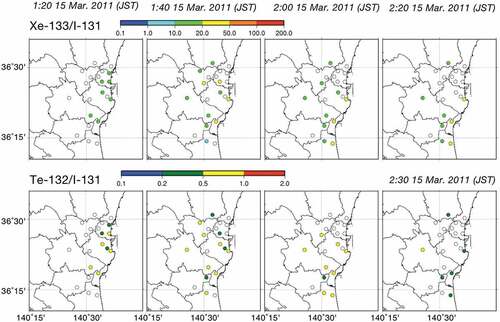
Figure 12. Same as but in P2B.
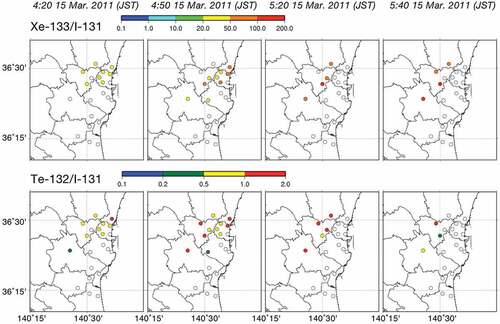
Figure 13. The spatial distribution of Te-132/I-131 in Plume P2C.