
Figures & data
Figure 1. Drift-flux correlation development timeline.
Table 1. Relevant drift-flux correlations.
Figure 2. Velocity scaling of drift-flux parameters.
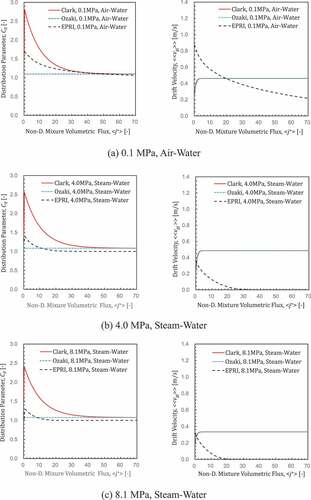
Figure 3. Distribution parameter of Clark et al. correlation [Citation5].
![Figure 3. Distribution parameter of Clark et al. correlation [Citation5].](/cms/asset/200c77a3-9efc-4683-9278-97eeacfa31db/tnst_a_1700843_f0003_c.jpg)
Figure 4. Rod bundle test section of the Purdue University 8 × 8 bundle [Citation4].
![Figure 4. Rod bundle test section of the Purdue University 8 × 8 bundle [Citation4].](/cms/asset/2ad571e6-daea-4e71-8160-7ec0872f6e07/tnst_a_1700843_f0004_oc.jpg)
Figure 5. Rod bundle data of the Purdue University 8 × 8 bundle [Citation4].
![Figure 5. Rod bundle data of the Purdue University 8 × 8 bundle [Citation4].](/cms/asset/62c689d1-9a5c-474a-8fd6-00ef0089fad2/tnst_a_1700843_f0005_c.jpg)
Figure 6. Rod bundle data of the ORNL/THTF 8 × 8 bundle [Citation19].
![Figure 6. Rod bundle data of the ORNL/THTF 8 × 8 bundle [Citation19].](/cms/asset/8d9e2be2-5fd2-4aba-9f17-88ea4c05f3ec/tnst_a_1700843_f0006_c.jpg)
Table 2. Analysis cases for Purdue University rod bundle tests.
Figure 7. Nodalization for Purdue University bundle analyses.
Figure 8. Predicted void fraction profiles (Measured void fractions are also plotted with the ±10% error band).
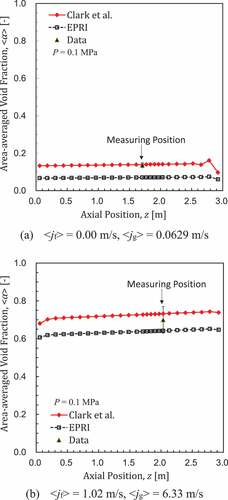
Figure 9. Void fraction prediction for Purdue University bundle tests.
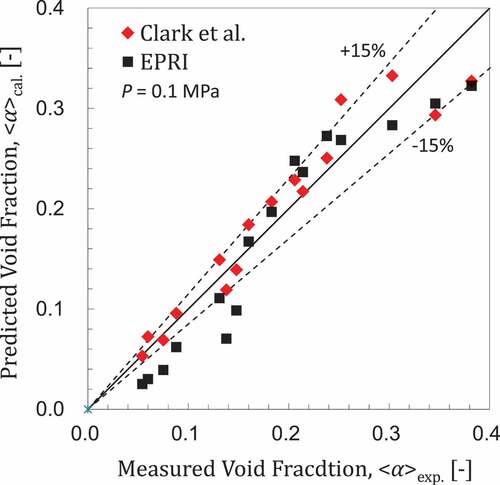
Figure 10. Nodalization for ORNL/THTF bundle analyses.
Table 3. Analysis cases for ORNL/THTF rod bundle tests.
Figure 11. Predicted void fraction profiles.
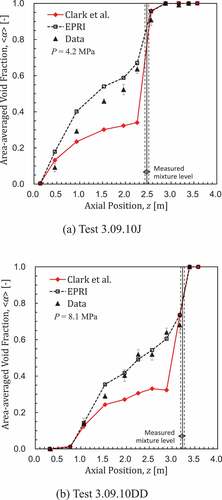
Figure 12. Void fraction prediction for ORNL/THTF bundle tests.
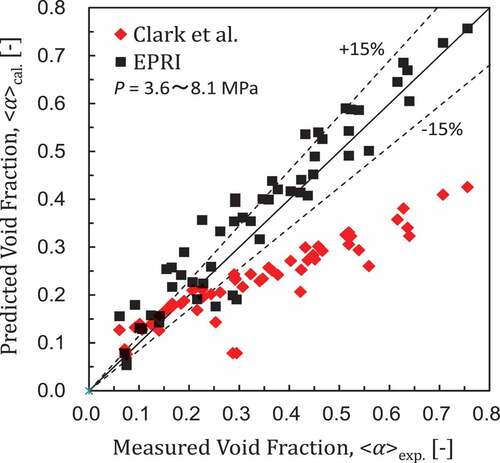
Figure 13. Correction factor.
Figure 14. Distribution parameters.
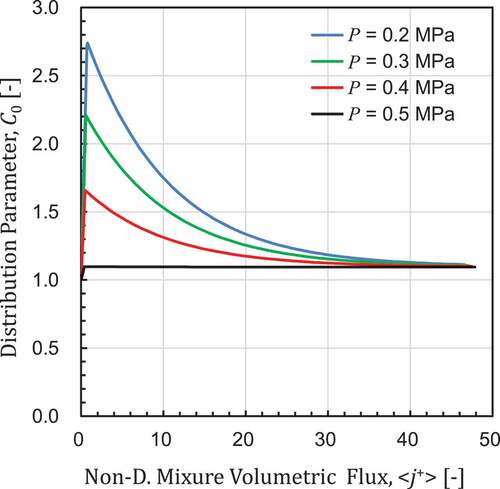
Figure 15. Predicted void fraction profiles.
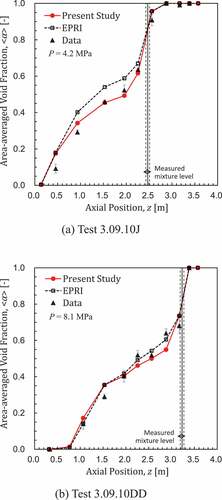
Figure 16. Void fraction prediction for ORNL/THTF bundle tests.
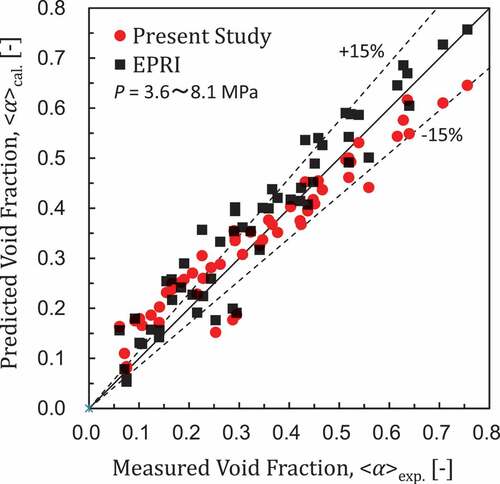
Table 4. Prediction uncertainty of drift-flux correlations for ORNL/THTF data.