Figures & data
Figure 1. A fuel loading pattern and k-infinity vector.
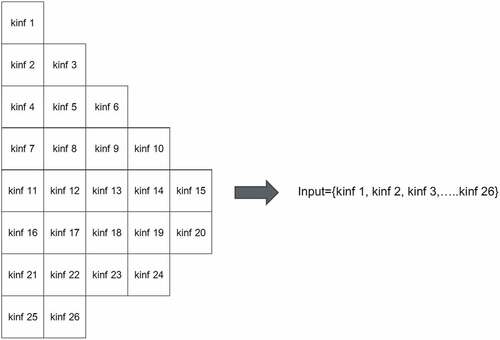
Figure 2. Core geometry used in optimization calculations.
Figure 3. Candidates of next moth position.
Figure 4. Generation of candidate moth and assignment of actual fuel inventory.
Figure 5. Flowchart of MFO with predator (MFO-P).
Figure 6. Flowchart of MSMFO-P.
Table 1. Fuel inventory used for optimization calculations.
Table 2. Calculation conditions used in the sensitivity analysis.
Figure 7. Result of sensitivity analysis of MSMFO-P.
Table 3. Calculation conditions of the conventional optimization methods.
Table 4. Optimization results of MSMFO-P.
Table 5. Optimization results of SA.
Table 6. Optimization results of Hybrid GA.
Table 7. Optimization results of PSO.
Figure 8. Comparison of objective function values satisfying limits.
Figure 9. Example of generated loading patterns by (a) MSMFO-P, (b) SA, (c) Hybrid GA, (d) PSO. Value in the assembly indicates k-infinity.
Table 8. Number of L3P loading patterns in which fresh fuel assemblies without Gd are loaded core inboard in 10 trials.
Table 9. Average and standard deviations of the L3P indexes in the last generation of MFO, MFO-P, MSMFO, and MSMFO-P.
Table 10. Average and standard deviations of the objective function of MFO, MFO-P, MSMFO, and MSMFO-P.
Figure 10. Averages of maximum L3P index of each method.