Figures & data
Figure 1. Bubble behaviour in the pool. (1) Bubble formation at the downcomer outlet, (2) Detached bubble, (3) Initial large bubble, (4) Steam condensation and break-up of the initial bubble, (5) Rising small bubbles, (6) Further break-up.
Figure 2. FPs removal mechanisms in the bubble.
Figure 3. Test facility. (1) Steam generator, (2) Air compressor, (3) Drywell, (4) Wetwell, (5) Downcomer pipe, (6) Suppression pool, (7) Heat exchanger.
Figure 4. Results of image processing: (a) Input image, (b) Binary image, (c) Morphologically filtered image, (d) Detected bubble boundaries.
Figure 5. Air content effect on SMD at the pool surface under ~0.6 m submergence (D0 = 12.48 mm).
Figure 6. Air effect on bubble rising velocity at the pool surface under ~0.9 m submergence (D0 = 12.48 mm).
Figure 7. Submergence effect on SMD at the pool surface (D0 = 52.48 mm).
Figure 8. Submergence effect on bubble rising velocity at the pool surface (D0 = 52.48 mm).
Figure 9. Temperature effect on SMD at the pool surface under ~0.9 m submergence (D0 = 12.48 mm).
Figure 10. Bubble observation at downcomer outlet.
Figure 11. Temperature effect on bubble rising velocity at the pool surface under ~0.6 m submergence (D0 = 52.48 mm).
Figure 12. Thermal stratification effect on SMD at the pool surface under ~0.6 m submergence.
Figure 13. Thermal stratification effect on bubble rising velocity at the pool surface under ~1.5 m submergence.
Figure 14. Temperature distribution in S/P with thermal stratification (~1.5 m submergence).
Figure 15. Downcomer size effect on SMD at the pool surface under ~0.9 m submergence.
Figure 16. Downcomer size effect on bubble rising velocity at the pool surface under ~1.5 m submergence.
Table 1. Ratio of bubble parameters between experimental and analysis values.
Figure 17. Comparison of bubble diameters with models in pool scrubbing codes.
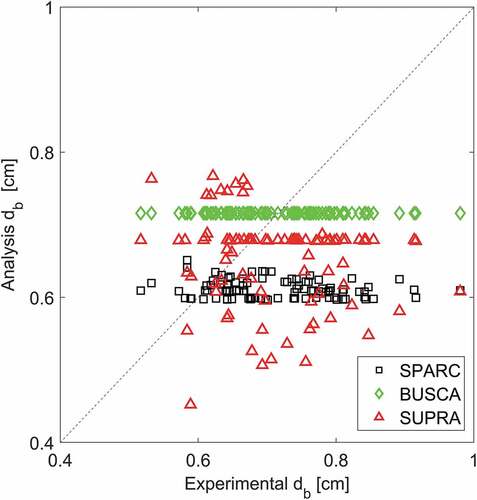
Figure 18. Comparison of bubble rising velocity with models in pool scrubbing codes: (a) SPARC, (b) BUSCA, (c) SUPRA.
Table 2. Ratio of deposition velocities between experimental and analysis results.
Table 3. Deposition velocities (m/s) of separate retention mechanisms based on measured SMD and vb.
Figure 19. Measurement of bubble temperature at D/C outlet.
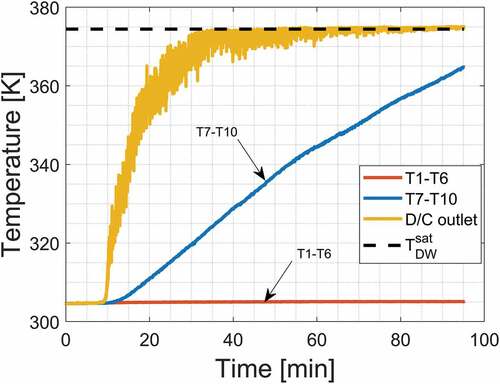
Figure 20. Average steam mass concentration difference in the bubble.
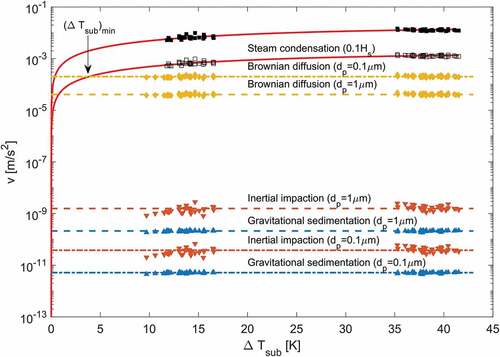
Figure 21. Comparison of deposition velocities' magnitudes based on measured SMD and vb.