
Figures & data
Figure 1. Phase diagrams of Fe-B and Zr-B systems, sample compositions marked in lines [Citation10,Citation11].
![Figure 1. Phase diagrams of Fe-B and Zr-B systems, sample compositions marked in lines [Citation10,Citation11].](/cms/asset/a02e6754-6f97-4fac-9291-67d66c043df0/tnst_a_1736201_f0001_oc.jpg)
Table 1. Sample compositions of the as-prepared Zr-B and Fe-B samples and ICP-MS results.
Figure 2. XRD patterns of (a) Zr-B and (b) Fe-B samples.
Figure 3. SEM images and element mappings of (a) Fe0.84B0.16 (b) Fe0.37B0.63 (c) Zr0.86B0.14.
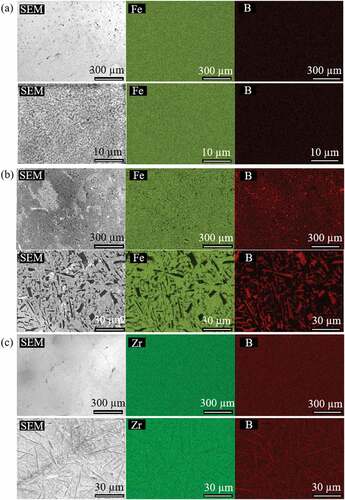
Figure 4. SEM image and element mappings of Zr0.68B0.32.
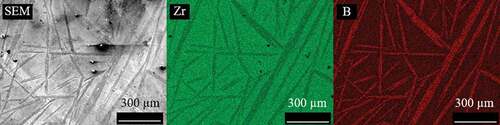
Figure 5. Vickers hardness measurement indentations on (a)Zr0.68B0.32 (b)Zr0.86B0.14.
Figure 6. Vickers hardness measurement indentations on (a)Fe0.84B0.16 (b)Fe0.37B0.63.
Figure 7. The iso-strain Voigt model, iso-stress Reuss model, as well as what we expect under realistic situations.
Figure 8. Relationship between precipitate volume fraction and indentation hardness of (a) Zr-B (b) Fe-B alloys.
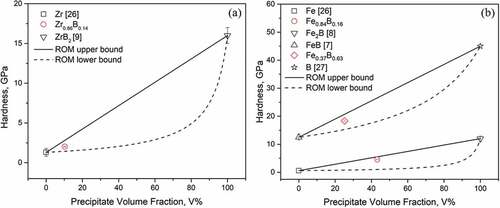
Table 2. Indentation hardness of Zr-B and Fe-B alloys.
Figure 9. Relationship between boron composition and indentation hardness of (a) Zr-B (b) Fe-B alloys.
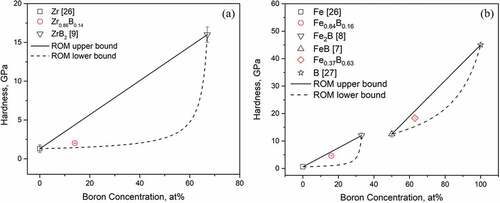
Figure 10. Relationship between temperature and thermal conductivity of (a) Zr-B (b) Fe-B alloys.
Figure 11. Composition dependence of thermal conductivity for Zr-B and Fe-B alloys at room temperature.
Table 3. Thermal conductivity of Fe-B and Zr-B at room temperature.