Figures & data
Table 1. Range of plant conditions.
Figure 1. Schematic drawing of natural circulation under IVR conditions.
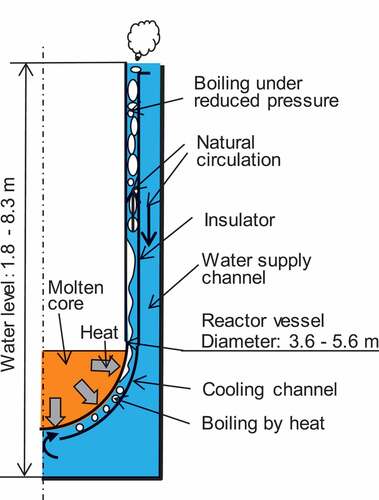
Table 2. Estimation results of thermal hydraulic parameters corresponding to position in the reactor vessel.
Figure 2. Angular variation of heat flux for a two-layer composition (typical case in a large-scale PWR).
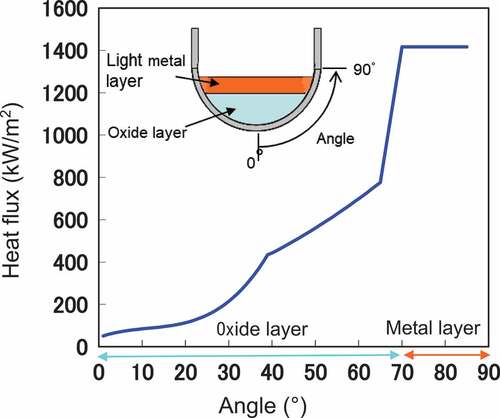
Figure 3. Angular variation of heat flux for a three-layer composition (typical case in a large-scale PWR).

Figure 4. Concept of the test section.
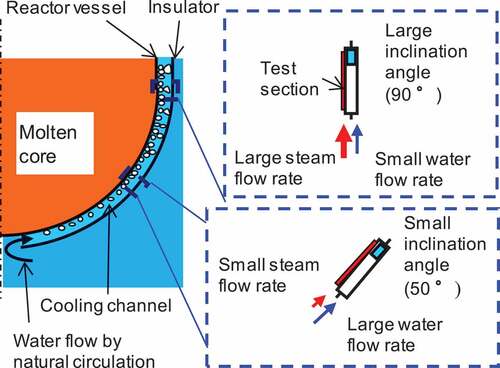
Figure 5. Schematic drawing of the test section.
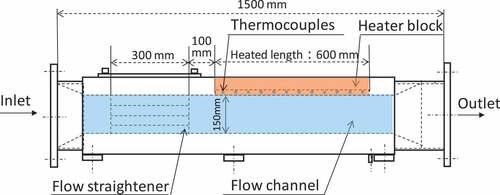
Figure 6. Photo of the test section.
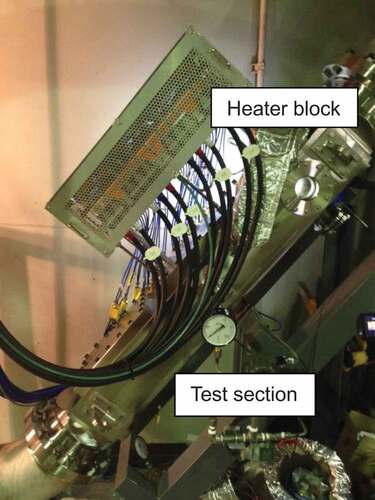
Figure 7. Loop diagram of the test equipment.
Figure 8. Time variation of heat flux and temperature in heater block.
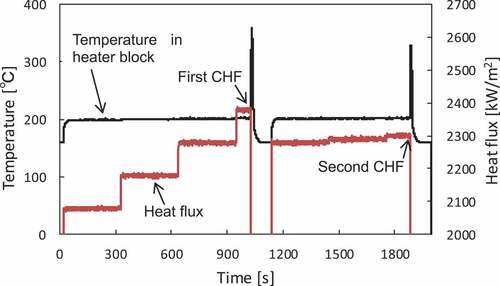
Figure 9. Comparison between measured CHF data and ULPU data.
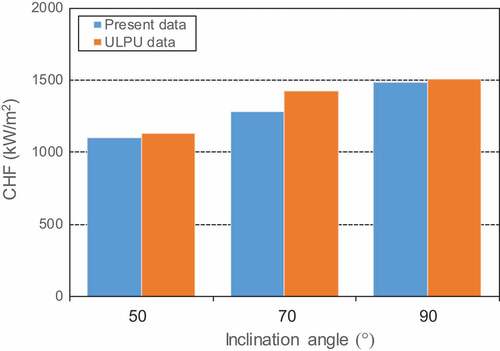
Table 3. Results of repeatability tests.
Figure 10. Relationships between CHF and inclination angle.
Figure 11. Relationships between CHF and pressure.
Figure 12. Relationships between CHF and mass flux.
Figure 13. Relationships between CHF and thermodynamic quality.
Figure 14. Comparison of CHF between experiment and SULTAN correlation.
Figure 15. Comparison of CHF between experiment and developed correlation.