
Figures & data
Figure 1. Seven-year temporal variation of 137Cs seawater concentrations (Bq/L) at the monitoring point termed ‘In front of shallow draft quay’, ‘West side in the port’, and ‘South side in the port’ displayed in the right-hand-side insert figure. The left-hand-side insert figure is an enlarged view of a part of the main figure.
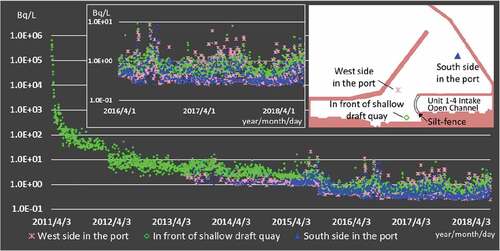
Figure 2. Temporal variation of the monthly frequency in which the measurement result was beneath the detection limit whose application period is displayed along the upper arrows.
Table 1. Monthly estimation of the discharge inventory of 137Cs (Bq/month) using the improved Kanda method (partly improved by the authors) in the period from April 2011 to June 2018.
Figure 3. Main panel: Seven-year temporal variation of monthly estimation of the 137Cs discharge inventory from the 1 F port by using the improved Kanda method (partly improved by the authors) in the period from April 2011 to June 2018, and inserted one: Focused variation of the main panel.
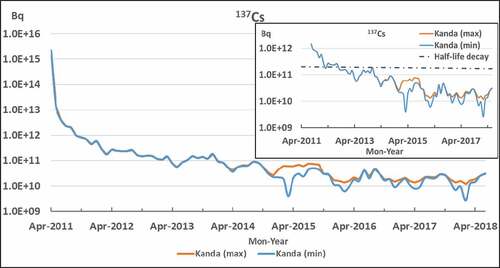
Figure 4. Changing history of monitoring points inside the 1 F port: (a) from April 2011 to May 2013 and (b) from August 2013 to July 2018. [Base map data: Website of The Geospatial Information Authority of Japan. (http://www.gsi.go.jp/ENGLISH/index.html)].
![Figure 4. Changing history of monitoring points inside the 1 F port: (a) from April 2011 to May 2013 and (b) from August 2013 to July 2018. [Base map data: Website of The Geospatial Information Authority of Japan. (http://www.gsi.go.jp/ENGLISH/index.html)].](/cms/asset/d79018f2-6e0f-475b-af7e-262bd7ed2913/tnst_a_1740809_f0004_oc.jpg)
Table 2. Monthly estimation of the discharge inventory of 137Cs (Bq/month) using the Voronoi tessellation method in the period from April 2011 to June 2018.
Figure 5. Main panel: Seven-year temporal variation of monthly estimation of the 137Cs discharge inventory from the 1 F port by using the Voronoi tessellation method with the Kanda method (minimum estimation only) in the period from April 2011 to June 2018 and inserted one: Focused variation of the main panel.
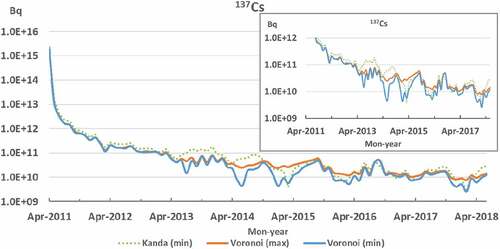
Table 3. Comparison of annual estimations of the 137Cs discharge inventory (Bq/year) from the 1 F port by using two methods, one of which is the improved Kanda method (partly improved by the authors) and another of which uses the Voronoi tessellation method.
Figure 6. Schematic figure for the coastal region around the 1 F port, in which the white line roughly indicates 20 km range distant from the land and median values of measured seawater concentrations of 137Cs are displayed for the corresponding areas. [Map data: Google, ZENRIN].
![Figure 6. Schematic figure for the coastal region around the 1 F port, in which the white line roughly indicates 20 km range distant from the land and median values of measured seawater concentrations of 137Cs are displayed for the corresponding areas. [Map data: Google, ZENRIN].](/cms/asset/1393a427-05f2-4986-8197-fe9d2a74f471/tnst_a_1740809_f0006_b.gif)