
Figures & data
Figure 1. The mean fractional fission product yield mass distribution of U,
Pu, and
Pu for the declared thermal-neutron energy from the ENDF/B-VII.1 database [Citation15]. See online version for color.
![Figure 1. The mean fractional fission product yield mass distribution of 235U, 239Pu, and 241Pu for the declared thermal-neutron energy from the ENDF/B-VII.1 database [Citation15]. See online version for color.](/cms/asset/2b486a89-1c6c-46ec-af3a-b055b1677069/tnst_a_1742812_f0001_oc.jpg)
Figure 2. The fission cross section of U,
Pu,
Pu, and
U vs. log-energy from the ENDF/B-VII.1 database [Citation15] as described in the legend. The vertical lines, with various shades of cyan and dash-dot patterns according to the legend, mark energies indicated as the fission yield production energy in the ENDF database. See online version for color.
![Figure 2. The fission cross section of 235U, 239Pu, 241Pu, and 238U vs. log-energy from the ENDF/B-VII.1 database [Citation15] as described in the legend. The vertical lines, with various shades of cyan and dash-dot patterns according to the legend, mark energies indicated as the fission yield production energy in the ENDF database. See online version for color.](/cms/asset/022456e0-c539-4bcb-97b4-992819623924/tnst_a_1742812_f0002_oc.jpg)
Figure 3. The graphite and high-density polyethylene infill for the PUNITA cavity (black outline) around the neutron generator and sample shuttle for the later experiments. See online version for color.
Table 1. The list of campaign runs for the associated samples and interrogation as noted in the text used in this study with the ‘0.00’ indicating there was no U and/or Pu, but with additional Al material.
Figure 4. The gamma rays produced by the PUNITA deuterium-tritium neutrons from Al,
Mg, and
Na from the (n,
), (n,p), and (n,
) reaction modes on the
Al in the dummy sample.
Figure 5. The relative positions of the PUNITA deuterium-tritium neutron generator and detector compared to the vertically transferred CBNM U and PuGa samples. See online version for color.
Figure 6. A comparison of Runs 201614 and 201610 between 2700- and 3650-keV. Note, the visible peaks not listed in fail at least one quality cut.
Table 2. Gamma-ray peaks fit mean energy and Gaussian counts from the noted short-lived fission products that pass the relative peak significance cut and compared for composition and measurement time () differences as indicated for the Run listed in . The values are rounded to the uncertainty.
Figure 7. A comparison of Runs 201814 and 201817 between 2700- and 3650-keV.
Table 3. A list of many important fission products emitting at least one gamma ray with energy 2.7 MeV useful for peak-ratio comparison of delayed gamma-ray spectroscopy or higher-yield parent fission products from the ENDF/B-VII.1 database [Citation15]. Also listed are their associated half-life and fission yields with the numbersin parentheses indicating the uncertainty on the last digit of the value.
Table 4. Gamma-ray peaks fit mean energy and relative Gaussian counts from compared to the 3575-keV peak from Y. The number in parentheses is the uncertainty on the last digit of the value based on the smallest overall digit in the uncertainties.
Figure 8. A comparison of some of the major U fission product peaks in Run 201817 integrated through the cycle time. See online version for color.
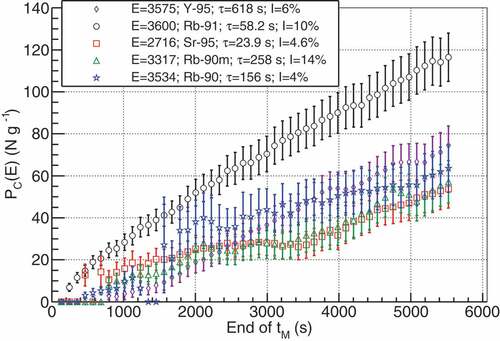
Figure 9. A comparison of some of the major Pu fission product peaks in Run 201814 integrated through the cycle time. See online version for color.
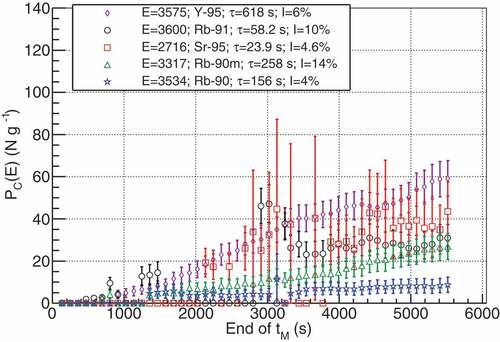
Figure 10. A comparison of peak-ratios of the major U fission product peak counts in proportional to the 3575-keV peak. Additionally, the same peak ratios from Run 201610 are shown for comparison. See online version for color.
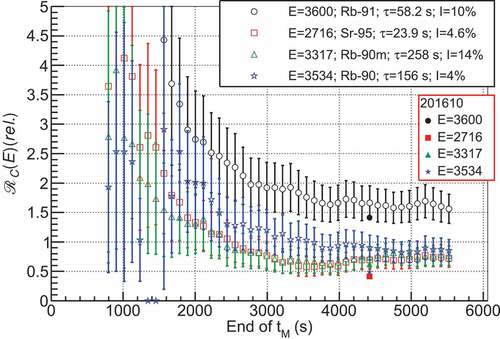
Figure 11. A comparison of peak-ratios of the major Pu fission product peak counts in proportional to the 3575-keV peak. Additionally, the same peak ratios from Run 201614 are shown for comparison. See online version for color.
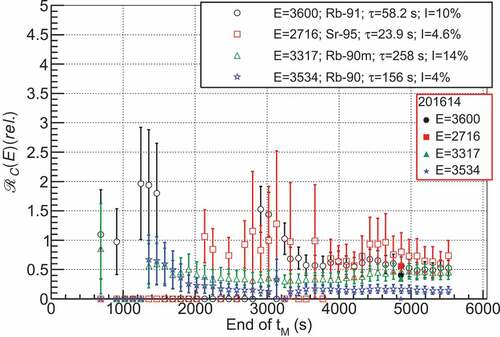
Table 5. Gamma-ray peaks fit mean energy, Gaussian counts, and t-test CDF results from different U content and interrogated as Runs 201502 and 201503 (see ). Also listed are the 201502 mass values scaled (201502’) to the 201503 mass and mass with self-shielding correction. The CDF is noted to the first different digit in the integrated values.
Table 6. Gamma-ray peaks fit mean energy, Gaussian counts, and t-test CDF results from different U content and interrogated as Runs 201616 and 201610 (see ). Also listed are the 201616 mass values scaled (201616') to the 201610 mass and mass with self-shielding correction. The CDF is noted to the first different digit in the integrated values.
Table 7. Gamma-ray peaks fit mean energy and Gaussian counts from increasing U mass with the same Pu sample base and interrogated with the same periodic time pattern and scaled to the total fissile mass (see ). Also shown are the relative increase of those peaks appearing in multiple spectra for sequentially greater U.
Figure 12. A comparison of total counts above the indicated energy in compared to the total fissile mass of the combined samples.
Figure 13. A comparison of peak-ratios of the fission product peak counts in compared to the mass-volume of the combined samples for those peaks that are in all four spectra. See online version for color.
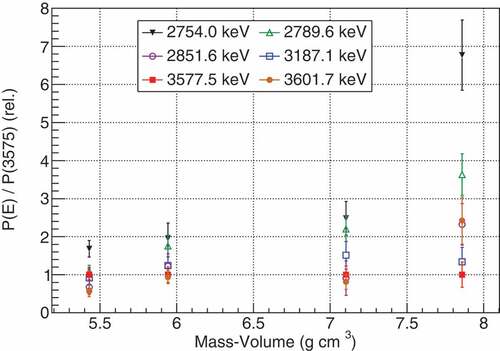
Table 8. Gamma-ray peaks fit mean energy and Gaussian counts from increasing Pu mass interrogated with the same interrogation pattern (see ). These values are integrated through the maximum of Run 201811 that stopped at 33 cycles.