Figures & data
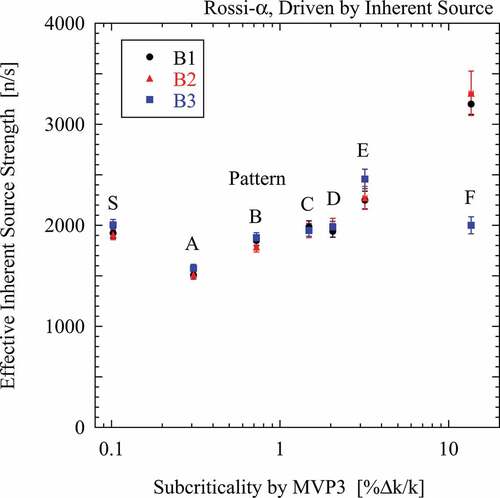
Figure 1. Description of 1/8”P60EUEU fuel assembly.
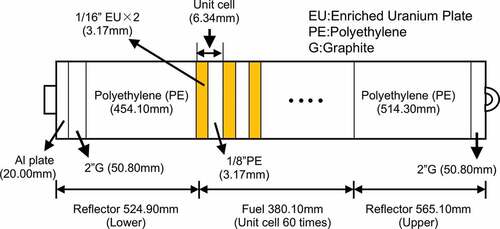
Figure 2. Top view of core configuration and neutron detector location.
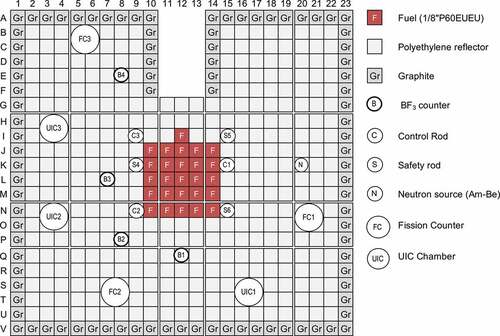
Table 1. Experimental patterns of control rods and central fuel loading.
Table 2. Isotopic properties of uranium used in the present calculation.
Table 3. Inherent neutron source strength per enriched fuel plate [n/s/plate].
Table 4. Total inherent neutron source strength of the present core.
Figure 3. Subcriticality dependence of neutron count rate measured for subcritical systems driven by inherent source.
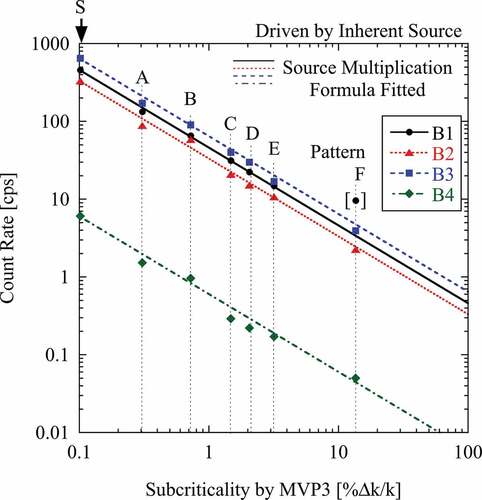
Figure 4. Subcriticality dependence of neutron count rate measured for subcritical systems driven by Am-Be source.
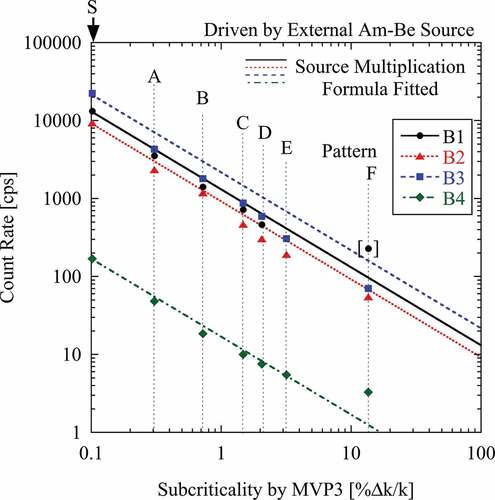
Figure 5. Subcriticality obtained by neutron source multiplication method for subcritical systems driven by inherent source.
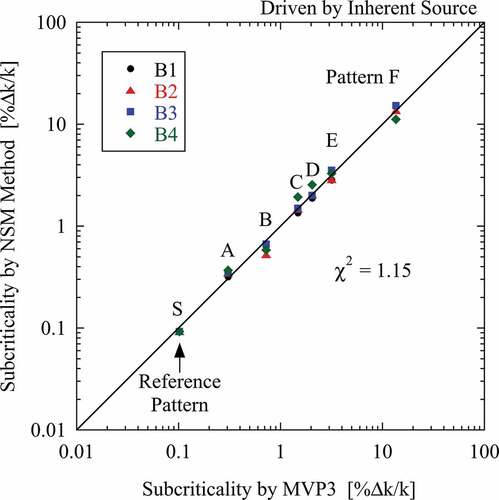
Figure 6. Subcriticality obtained by neutron source multiplication method for subcritical systems driven by Am-Be source.
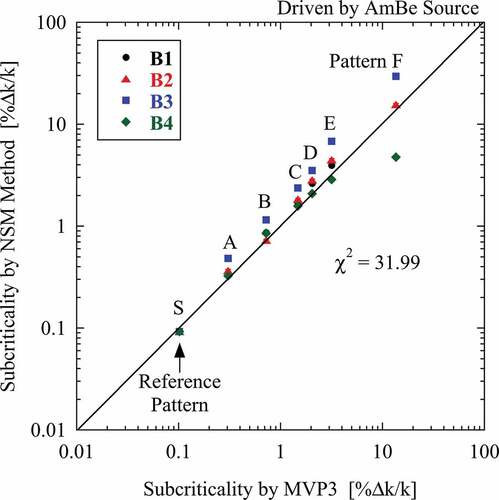
Figure 7. Subcriticality dependence of Y obtained by Feynman-α analysis under reactor drive by inherent source.
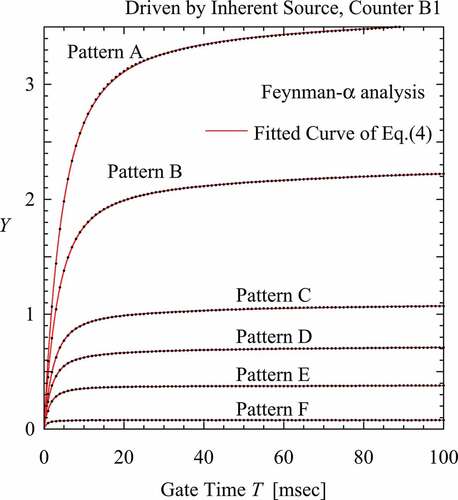
Figure 8. Non-physical behavior of correlation amplitude Y of counter B4.
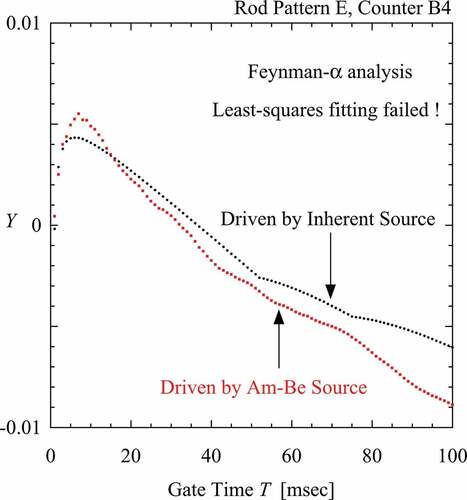
Figure 9. Prompt-neutron decay constant obtained from Feynman-α analysis for subcritical systems driven by inherent source.
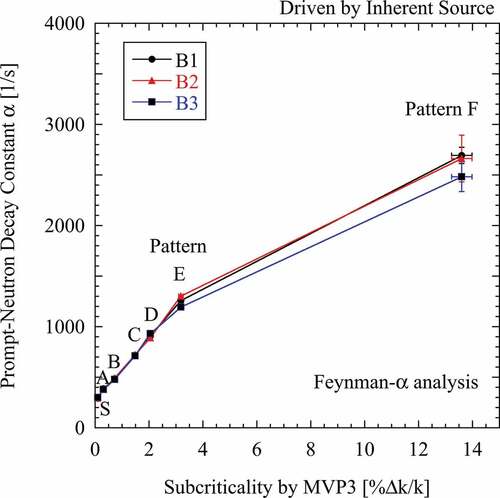
Figure 10. Prompt-neutron decay constant obtained from Feynman-α analysis for subcritical systems driven by Am-Be source.
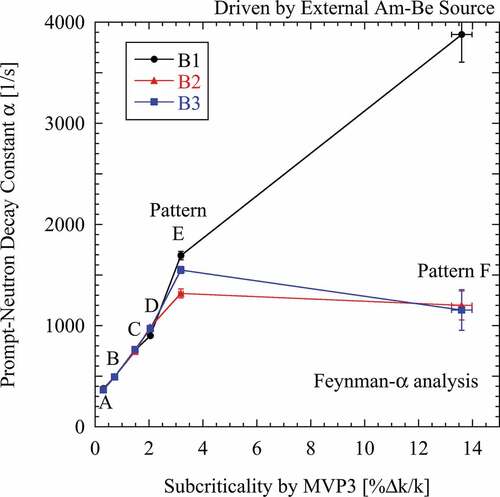
Figure 11. Subcriticality dependence of conditional counting probability obtained by Rossi-α analysis under reactor drive by inherent source.
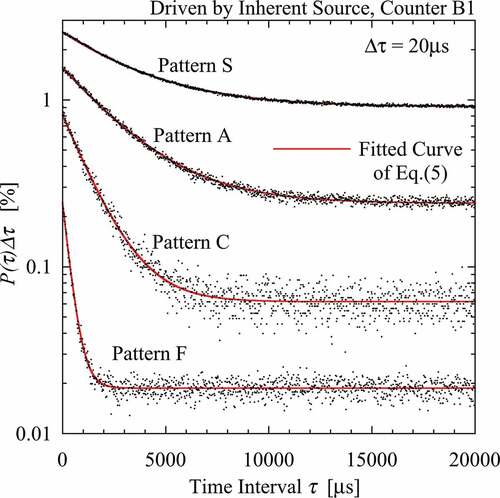
Figure 12. Comparison of Rossi-α conditional counting probability under respective drives by inherent and Am-Be source.
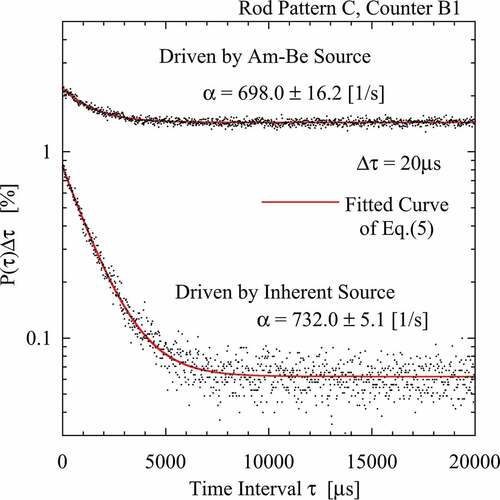
Figure 13. Prompt-neutron decay constant obtained by Rossi-α analysis under reactor drive by inherent source.
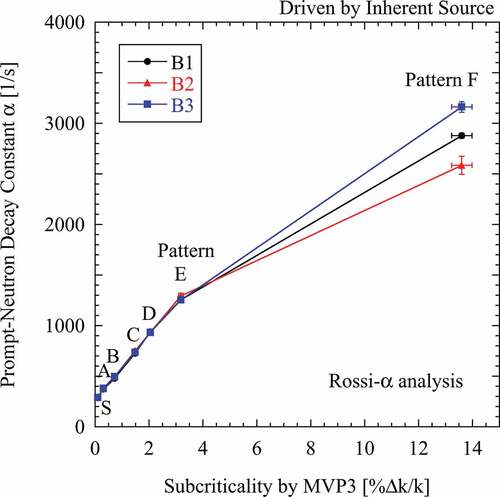
Figure 14. Prompt-neutron decay constant obtained by Rossi-α analysis under reactor drive by Am-Be source.
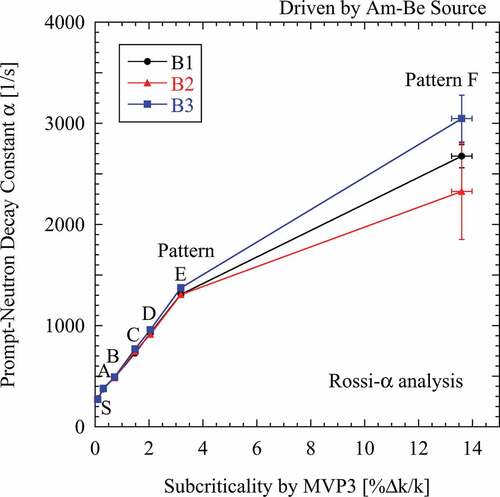
Figure 15. Ratio of standard deviation to mean of prompt-neutron decay constants obtained by Feynman-α analysis for three neutron counters.
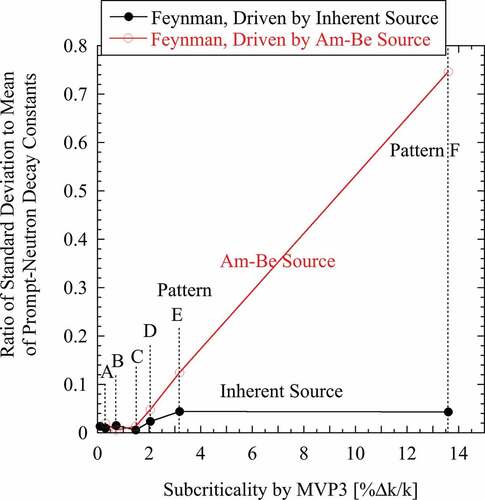
Figure 16. Subcriticality derived from prompt-neutron decay constant by using Simmons & King method.
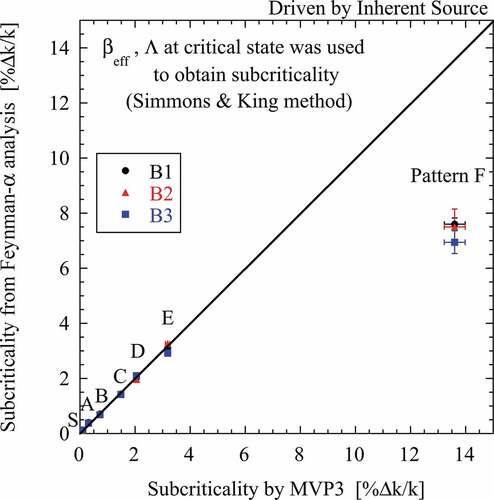
Figure 17. Subcriticality dependence of kinetic parameters calculated by MVP3.
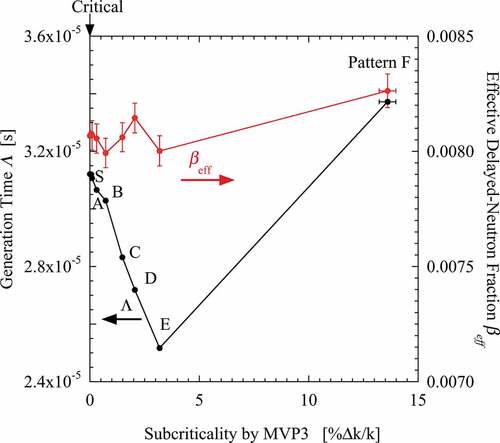
Figure 18. Subcriticality obtained from prompt-neutron decay constant by using the inhour method.
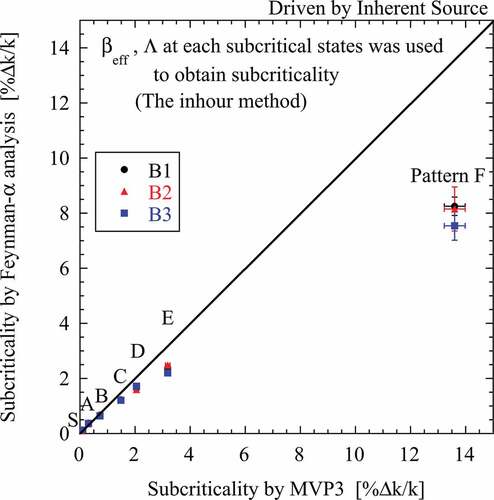
Figure 19. S/N ratio of Rossi-α analysis under respective reactor drives by inherent and Am-Be sources.
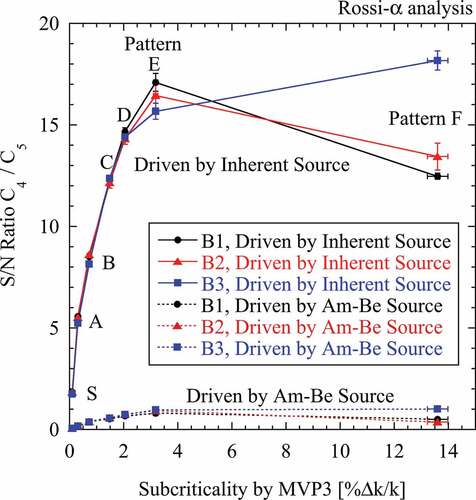
Figure 20. Effective inherent source strength derived from Rossi-α analysis.