Figures & data
Figure 1. Schematic view and basic specifications of the experimental setup of the TeRRa
Table 1. Experimental conditions of the reproductive experiment for CsI transport behavior
Table 2. Amount of Cs and I obtained by ICP-MS on each sample
Figure 2. Results of SEM/EDS observations of the deposits on the sampling coupons (a) No. 3 (980 K), (b) No. 9 (860 K), and (c) No. 32 (400 K)
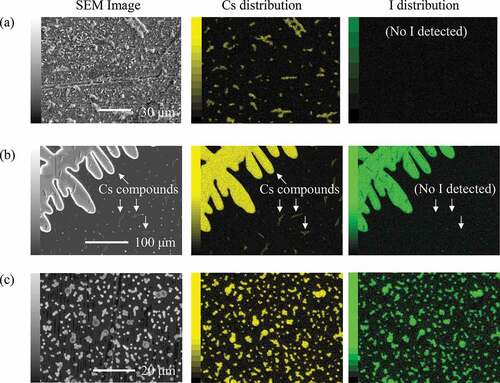
Figure 3. XRD patterns of the deposits on the sampling coupons (a) No. 3 (980 K), (b) No. 9 (860 K), and (c) No. 32 (400 K)
Figure 4. Raman spectrum of the deposits on the sampling coupon No. 9 (860 K)
Figure 5. Size distributions of the airborne aerosol particles extracted from each 100 K point of the TGT (‘N = ’ in red letters means total number of aerosol particles in Ar/steam atmosphere)
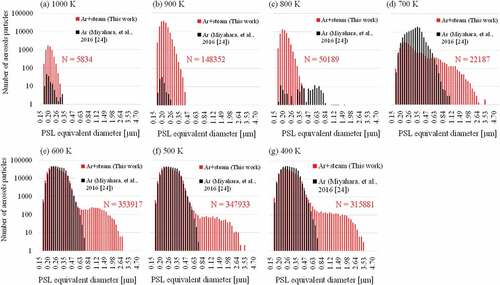
Figure 6. Cumulative amount of Cs and I obtained by ICP-MS on each cascade impactor plate, the backup filter, and the liquid traps during 5-min-extraction from 400 K point of the TGT
Figure 7. I chemical forms in the high-temperature region (>900 K) calculated by (a) chemical equilibrium calculation and (b) chemical reaction calculation