Figures & data
Figure 1. Fault tree of a dual parallel system [Citation7]
![Figure 1. Fault tree of a dual parallel system [Citation7]](/cms/asset/2f6a1fc6-6ce6-44d6-b4ee-fe49f982a19d/tnst_a_1899994_f0001_b.gif)
Figure 2. Fault tree of a triple parallel system
Figure 3. Process to evaluate the seismic diversity and robustness
Figure 4. Contours of the predicted inter-period correlation coefficient vs. T1 and T2 proposed by Baker and Jayaram [Citation38]
![Figure 4. Contours of the predicted inter-period correlation coefficient vs. T1 and T2 proposed by Baker and Jayaram [Citation38]](/cms/asset/3f89604c-34d2-400a-81c9-413da064b2db/tnst_a_1899994_f0004_oc.jpg)
Table 1. List of target sites and characteristics of seismic environment for each site
Figure 5. Location map of the site and major seismic sources [Citation40]. (The specific site locations are plotted on the J-SHIS’s map.). National Research Institute for Earth Science and Disaster Resilience (2019), J-SHIS, National Research Institute for Earth Sience and Disaster Resilience, <https://doi.org/10.17598/nied.0010>
![Figure 5. Location map of the site and major seismic sources [Citation40]. (The specific site locations are plotted on the J-SHIS’s map.). National Research Institute for Earth Science and Disaster Resilience (2019), J-SHIS, National Research Institute for Earth Sience and Disaster Resilience, <https://doi.org/10.17598/nied.0010>](/cms/asset/33294f03-02bb-4242-b3f6-87cb6837e2b5/tnst_a_1899994_f0005_oc.jpg)
Figure 6. Hazard curve of the acceleration response spectrum (T = 0.3 s)
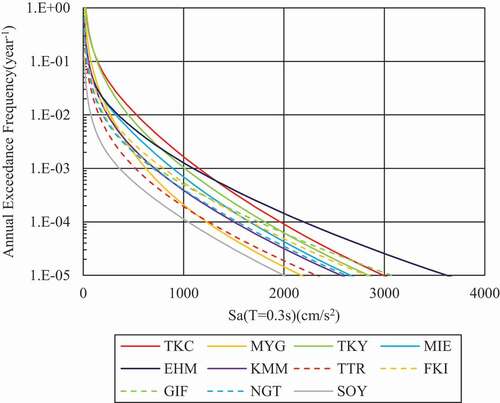
Figure 7. Hazard curve of the acceleration response spectrum (T = 3.0 s)
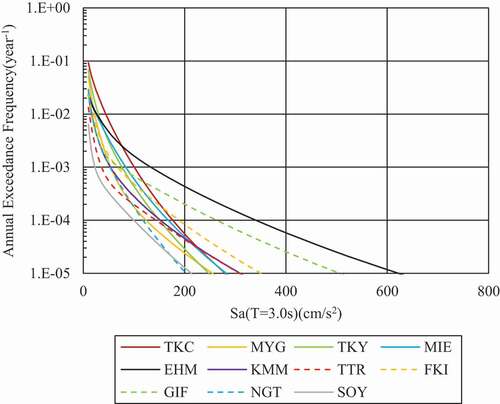
Figure 8. Contribution of the earthquake type to the hazard curve (T = 0.3 s)
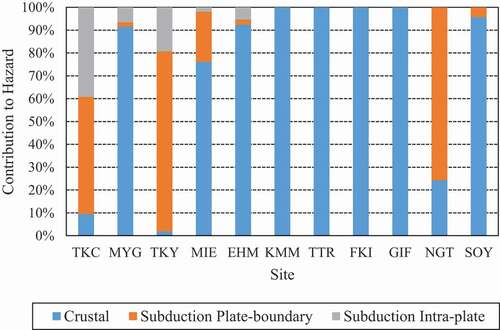
Figure 9. Contribution of the earthquake type to the hazard curve (T = 3.0 s)
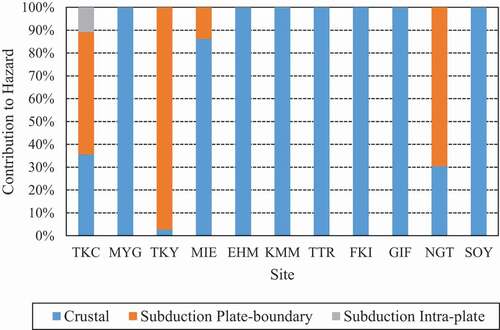
Figure 10. Median capacity of seismic designed and isolated devices
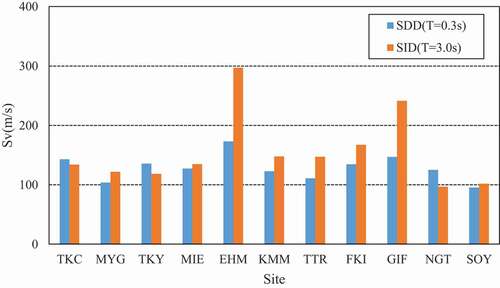
Figure 11. Relationship between inter-period correlation and failure probability (TKY, β = 0.3, β’ = 0.2)
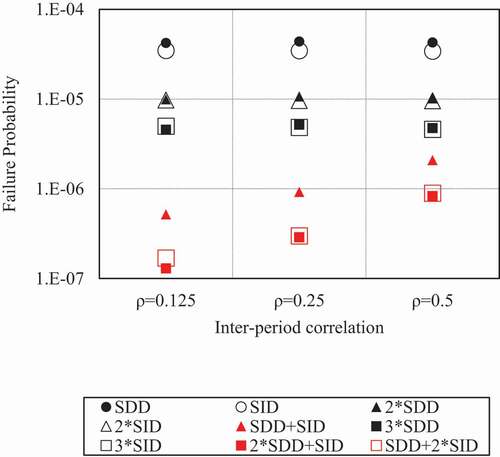
Figure 12. Relationship between capacity variability and failure probability (TKY, ρ = 0.25, β’ = 0.2)
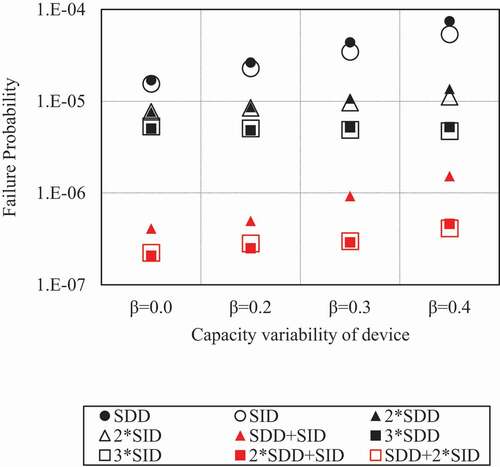
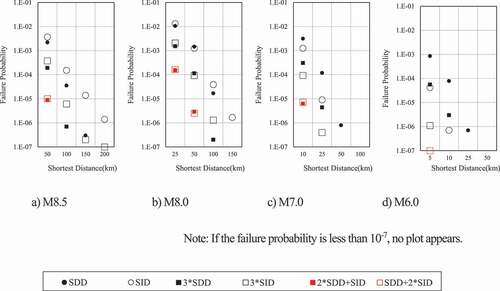
Figure 13. Failure probability for each site (ρ = 0.25, β = 0.3, β’ = 0.2) [Citation9]
![Figure 13. Failure probability for each site (ρ = 0.25, β = 0.3, β’ = 0.2) [Citation9]](/cms/asset/be94a8bc-5f56-4668-88e8-f10d9303d31d/tnst_a_1899994_f0013_oc.jpg)
Table 2. List of earthquakes with a high contribution to hazard curves
Table 3. Slope of the hazard curve of the acceleration response spectrum
Table 4. Cases to analyze the robustness
Figure 14. Failure probability of single device and dual system (TKY, ρ = 0.25, β = 0.3, β’ = 0.2)
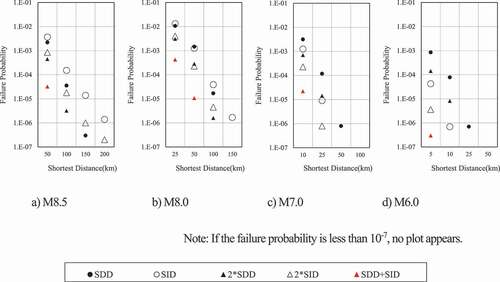
Figure 15. Failure probability of single device and triple system (TKY, ρ = 0.25, β = 0.3, β’ = 0.2)