
Figures & data
Table 1. Synthesis conditions of the U-SUS and U-SUS-Zr simulated debris and the chemical components identified by XRD and Raman spectroscopy.
Figure 1. (a) Schematic illustrations of the Raman microscopy measurement and a picture of a molded sample and its optical microscope images with different magnifications. The red-marked points on the optical microscope ×100 image are sample measurement points. (b) Backscattered electron (BSE) SEM image of the 4 U-SUS simulated debris sample and elemental mapping data obtained using EDX spectroscopy.
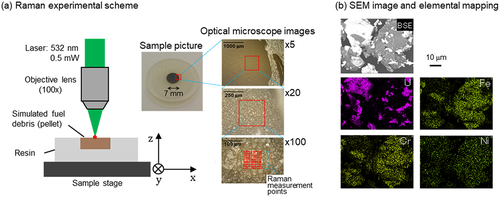
Figure 2. (a) Averaged Raman spectra of the U-SUS simulated debris (1–4). (b) A typical Raman spectrum of cubic UO2.
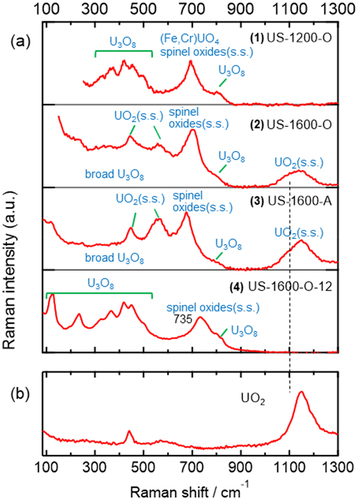
Figure 3. Nonaveraged (single-point) Raman spectra of the (Fe,Cr)UO4 uranate components observed in the 1 U-SUS debris.
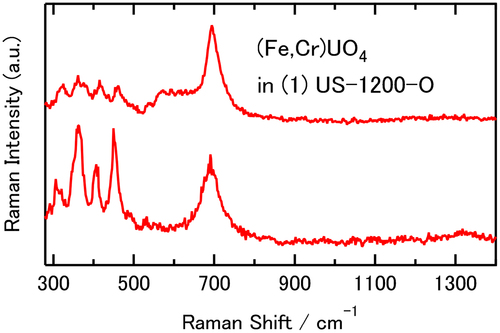
Figure 4. Representative some examples of the nonaveraged (single-point) Raman spectra of chemical components assignable to spinel oxides, observed in the 1–4 U-SUS simulated debris.
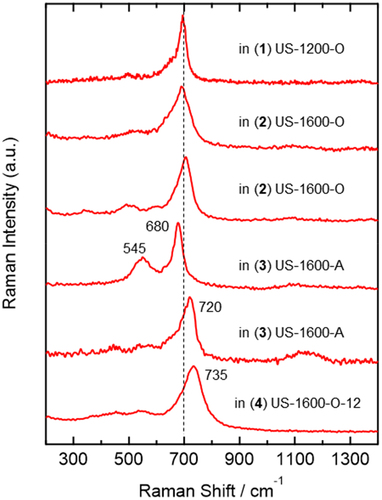
Figure 5. (a) Averaged Raman spectrum of a heated SUS sample. (b) XRD pattern of the heated SUS and some standard XRD data of spinel oxides available in the ICSD [Citation56].
![Figure 5. (a) Averaged Raman spectrum of a heated SUS sample. (b) XRD pattern of the heated SUS and some standard XRD data of spinel oxides available in the ICSD [Citation56].](/cms/asset/7c628824-3f4a-402f-a3a0-9ff5f3a6303f/tnst_a_2128460_f0005_oc.jpg)
Figure 6. Averaged Raman spectra of the U-SUS-Zr simulated debris (5–10).
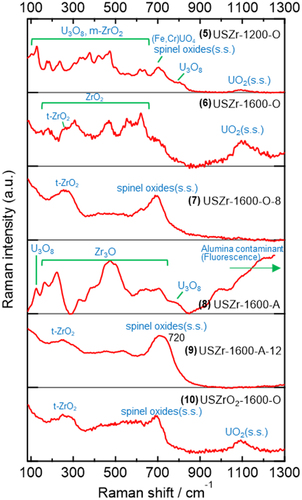
Figure 7. (a) Averaged Raman spectrum of a heated SUS-Zr sample. (b) XRD patterns of heated SUS and SUS-Zr samples.
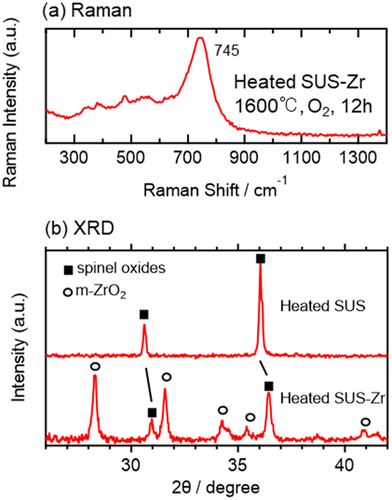
Figure 8. Representative some examples of nonaveraged (single-point) spectra assignable to ZrO2 components observed in the 5, 6, 8, and 9 U-SUS-Zr debris.
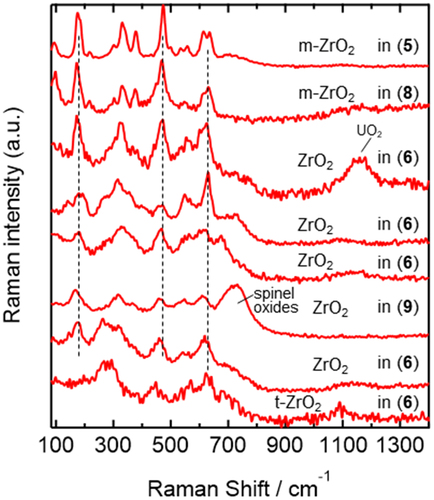
Figure 9. (a) Averaged Raman spectrum of the 8 U-SUS-Zr debris (the same as that in ) and Raman spectrum of a Zr sample heated at 1600°C in 2% O2 for 1 h. (b) XRD pattern of the heated Zr (1 h) and the standard XRD data of Zr3O in the ICSD [Citation56].
![Figure 9. (a) Averaged Raman spectrum of the 8 U-SUS-Zr debris (the same as that in Figure 2) and Raman spectrum of a Zr sample heated at 1600°C in 2% O2 for 1 h. (b) XRD pattern of the heated Zr (1 h) and the standard XRD data of Zr3O in the ICSD [Citation56].](/cms/asset/59c011db-ce96-40ad-a8de-762736d6d972/tnst_a_2128460_f0009_oc.jpg)