Figures & data
Figure 1. (a) the dissolved U concentration and (b) pH during the immersion experiments.
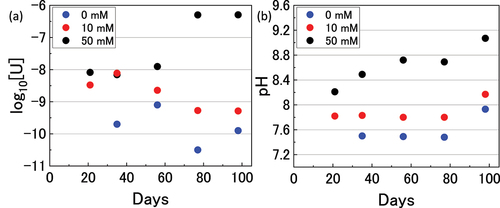
Figure 2. Speciation calculations for the UVI/bicarbonate system (a) considering solid phases, and considering aqueous speciation in (b) 0 mM, (c) 10 mM, and (d) 50 mM bicarbonate solution.
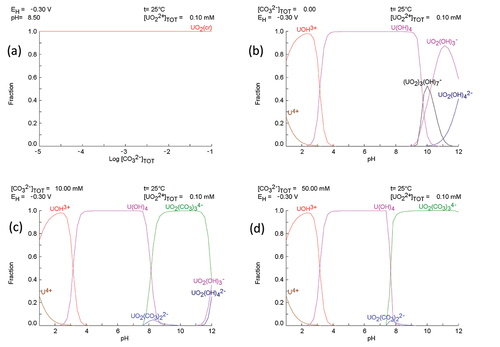
Figure 3. Optical images of the surface of the pellets (a) before immersion, and after immersion in (b) 0 mM, (c) 10 mM and (d) 50 mM bicarbonate solution (5000x magnification, scale bar = 10 µm).
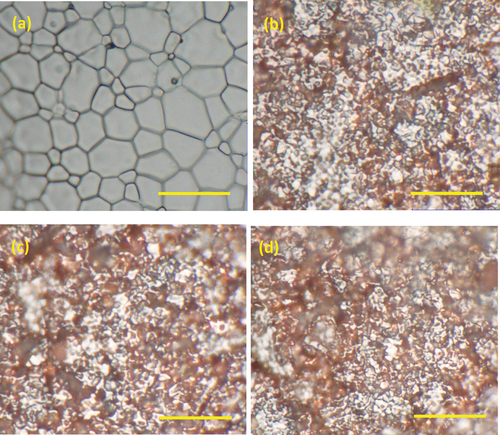
Figure 4. Averaged Raman spectra of the UO2 pellets immersed in NaHCO3 solution acquired by surface mapping.
Figure 5. An example of the Lorentzian band-shaped fit for (a) the T2g peak and defect band, and (b) the 2LO peak.
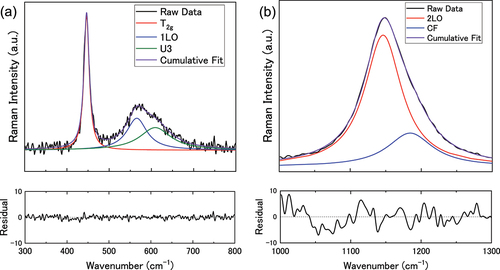
Figure 6. (a) the U3/T2g peak area ratio and (b) the 2LO/T2g peak area ratio as a function of bicarbonate concentration. Surface mapping was conducted on 11 x 11 grids at eight locations on the surface of each pellet and averaged.
Figure 7. Depth profile of the UO2 pellets immersed in bicarbonate solution showing the normalized T2g peak height.
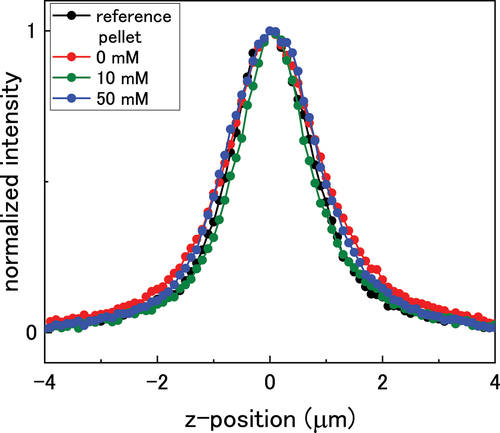
Figure 8. The normalised U3/T2g peak area ratio as a function of bicarbonate concentration in the z-direction through the oxide.
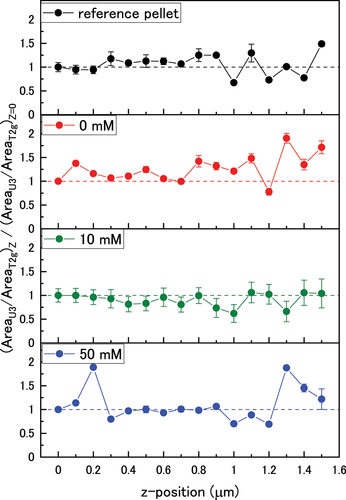
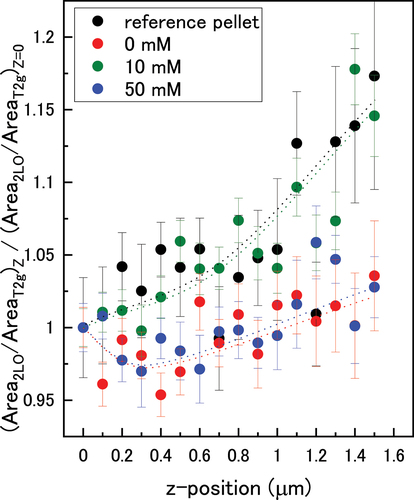
Figure 9. The normalized 2LO/T2g peak height ratios as a function of bicarbonate concentration in the z-direction through the oxide. Dotted lines are a guide for the eye.