
Figures & data
Figure 1. Energy spectra of antineutrinos and electrons from thermal-neutron induced fission of irradiated for
. The triangles for the electron spectra are experimental results by Schreckenbach et al. [Citation11], and corresponding ones for the antineutrinos are those converted from their data by them. Green dashed- and solid-lines are electron and antineutrino spectra calculated with FPY data of JENDL-5, while the blue ones are those calculated with FPY data of ENDF/B-VIII and those shown by red curves are calculated with FPY data of JEFF-3.3. In all these calculations, decay data were taken from JENDL-5. The data for electrons were multiplied by a factor of 0.1.
![Figure 1. Energy spectra of antineutrinos and electrons from thermal-neutron induced fission of 235U irradiated for 12h. The triangles for the electron spectra are experimental results by Schreckenbach et al. [Citation11], and corresponding ones for the antineutrinos are those converted from their data by them. Green dashed- and solid-lines are electron and antineutrino spectra calculated with FPY data of JENDL-5, while the blue ones are those calculated with FPY data of ENDF/B-VIII and those shown by red curves are calculated with FPY data of JEFF-3.3. In all these calculations, decay data were taken from JENDL-5. The data for electrons were multiplied by a factor of 0.1.](/cms/asset/6b940850-d472-46fa-a1ee-9490705923a2/tnst_a_2276418_f0001_oc.jpg)
Figure 2. Energy spectrum of antineutrinos from thermal neutrons irradiating for 12 hours. The calculations were done with FPY data of JENDL5. Numerous lines below the total spectrum show contributions from different FP nuclide.
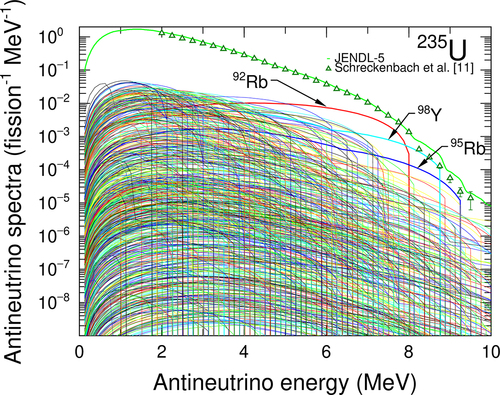
Figure 3. Energy spectra of antineutrinos and electrons from fast-neutron induced fission of irradiated for
. Meanings of the symbols and lines are the same as fig. 1, while the experimental electron and converted antineutrino spectra are results reported by Haag et al. [Citation12].
![Figure 3. Energy spectra of antineutrinos and electrons from fast-neutron induced fission of 238U irradiated for 42h. Meanings of the symbols and lines are the same as fig. 1, while the experimental electron and converted antineutrino spectra are results reported by Haag et al. [Citation12].](/cms/asset/917a566b-e3a8-4d6b-8a82-9d4173bd9045/tnst_a_2276418_f0003_oc.jpg)
Figure 4. The energy spectrum of antineutrinos from fast neutrons irradiating for 42 hand its composition from individual FP nuclide.
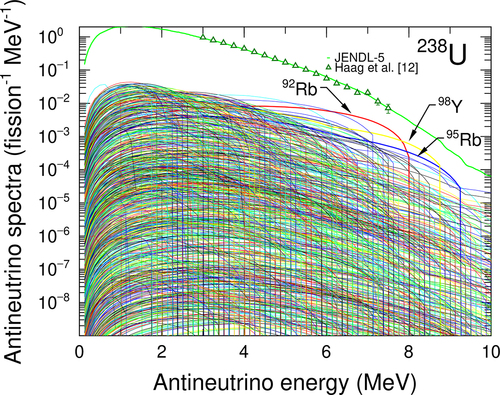
Figure 5. Energy spectra of antineutrinos and electrons from fast-neutron induced fission of irradiated for 1.5 days. Meanings of the symbols and lines are the same as fig. 1, while the experimental electron spectrum was taken from [Citation13], and converted antineutrino spectra were taken from
.
![Figure 5. Energy spectra of antineutrinos and electrons from fast-neutron induced fission of 239Pu irradiated for 1.5 days. Meanings of the symbols and lines are the same as fig. 1, while the experimental electron spectrum was taken from [Citation13], and converted antineutrino spectra were taken from 13−15.](/cms/asset/f48ac415-68c9-4e61-9801-91ef0fc8ffa3/tnst_a_2276418_f0005_oc.jpg)
Figure 6. Energy spectrum of anti-electron neutrinos from thermal neutrons irradiating for 1.5 days including contributions from
nuclides.
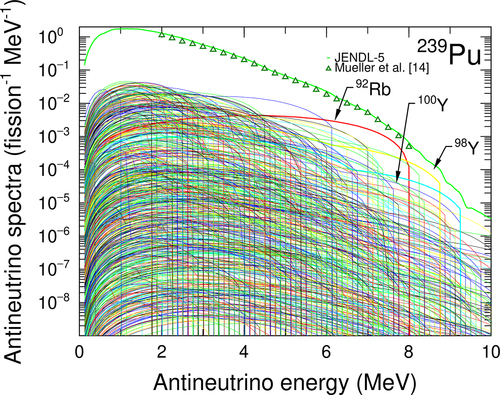
Figure 7. Energy spectra of antineutrinos and electrons from thermal-neutron induced fission of irradiated for 1.8 days. Meanings of the symbols and lines are the same as fig. 1, while the experimental electron and converted antineutrino spectra were taken from ref [Citation14].
![Figure 7. Energy spectra of antineutrinos and electrons from thermal-neutron induced fission of 241Pu irradiated for 1.8 days. Meanings of the symbols and lines are the same as fig. 1, while the experimental electron and converted antineutrino spectra were taken from ref [Citation14].](/cms/asset/bf315bf1-a3eb-465c-8329-39f8b8d7f5e0/tnst_a_2276418_f0007_oc.jpg)
Figure 8. Energy spectrum of antineutrinos from thermal neutrons irradiating for 1.8 days including contributions from FP nuclides.
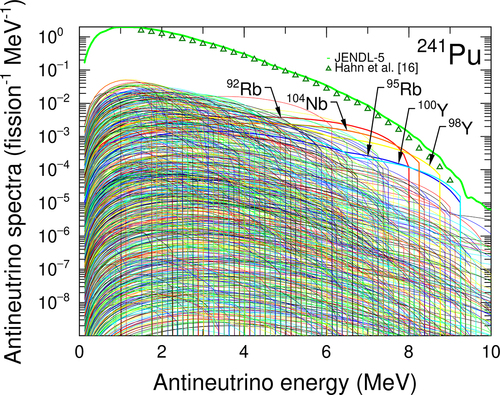
Figure 9. Energy spectra of aggregate antineutrinos detected via IBD reaction from thermal-neutron induced fission of and fast-neutron induced fission of
. Lines denote the results of our calculation, while symbols are those converted from measured electron spectra [Citation11–16]. See text for details.
![Figure 9. Energy spectra of aggregate antineutrinos detected via IBD reaction from thermal-neutron induced fission of 235U, 239,241Pu and fast-neutron induced fission of 238U. Lines denote the results of our calculation, while symbols are those converted from measured electron spectra [Citation11–16]. See text for details.](/cms/asset/fb994155-aaf8-461e-94c9-6ff234debdee/tnst_a_2276418_f0009_oc.jpg)
Figure 10. Fractions of the energy spectrum of antineutrinos detected by the inverse beta decay reaction below threshold energy shown by the horizontal axis.
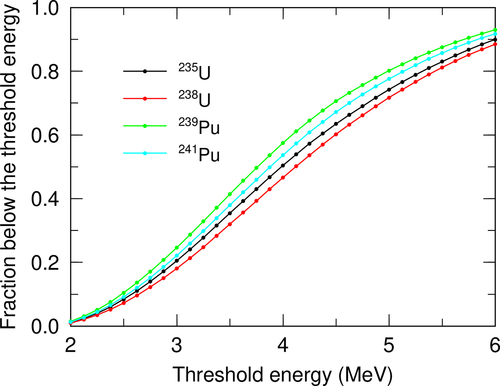
Figure 11. Top panel: Burnup (blue line, right axis) and the ratio of fissile to
(red line, left axis) as functions of burnup days (horizontal axis) with the initial fuel and burnup conditions of Mihama-3 reactor; bottom panel: the number of antineutrinos detected by IBD reaction (blue line, right axis) and the
index (red line, left axis) as function of burnup days for the same condition as the top panel.
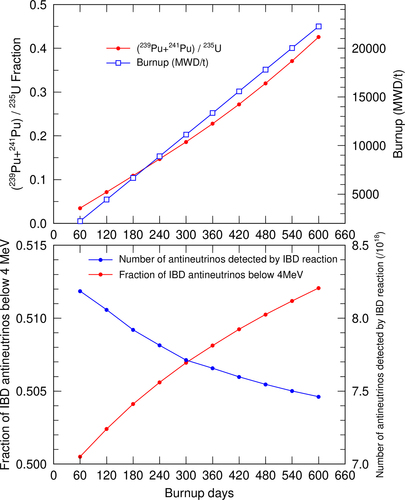
Table 1. Initial fuel composition of Mihama-3.
Figure 12. The top panel shows the relationship between the burnup (blue line, right axis) and the Pu fissile fraction (red line, left axis) as functions of the burnup day for a cycle of 400 days of operation and 60 days of shutdown, assuming the fuel composition of Mihama-3. The bottom panel shows the relationship between the burnup day and the number of antineutrinos detected by IBD reaction (blue line, right axis), and the fraction of antineutrinos with energy below index, red line, left axis).
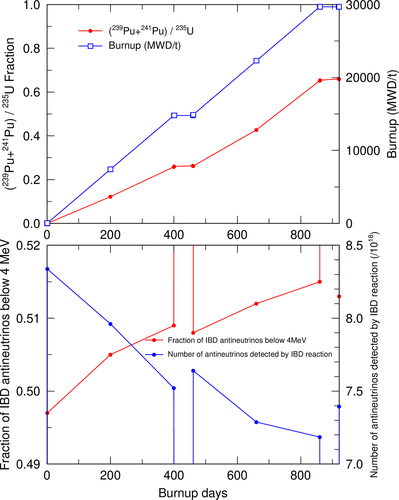
Figure 13. Energy spectra of antineutrinos detected by the IBD reaction on 400th day of a continuous operation (last day of the operation) shown by a red curve and on 401st day, after the first day of a shutdown period shown by the blue curve.
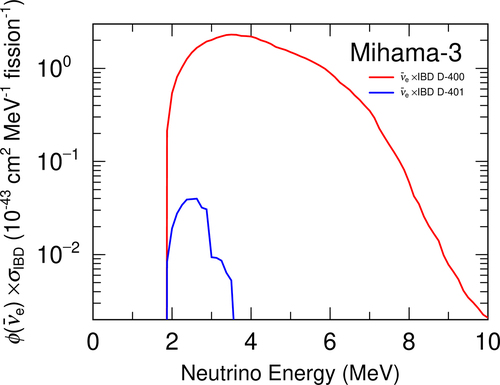
Figure 14. Top panel: burnup (blue line, right axis) and the ratio of fissile to
(red line, left axis) in a fast reactor as function of burnup days assuming a continuous operation for 600 days; bottom panel: number of antineutrinos detected by the IBD reaction (blue line, right axis), and the fraction of antineutrinos with energy below
(red line, left axis) as functions of burnup days.
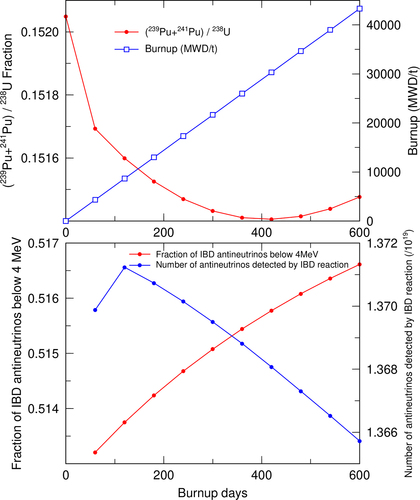
Table 2. Initial fuel composition of a standard fast reactor.