224
Views
0
CrossRef citations to date
0
Altmetric
Article

Measurements of keV-Neutron capture cross sections and capture gamma-ray spectra of 74,76,78,80,82Se

, , &
Pages 161-176 | Received 04 Jul 2023, Accepted 27 Oct 2023, Published online: 30 Nov 2023

Figures & data

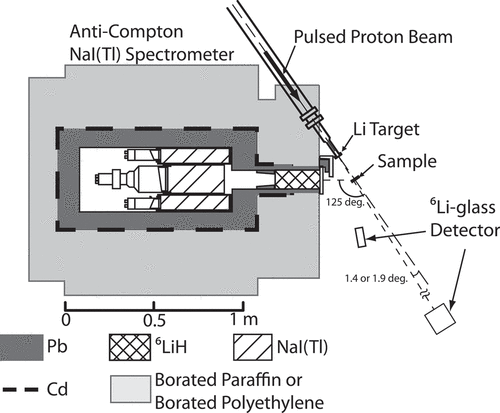
Figure 1. Experimental setup in the 550 keV measurements.

Figure 1. Experimental setup in the 550 keV measurements.

Table 1. Characteristics of samples.

Table 2. Average proton beam currents and measuring times.

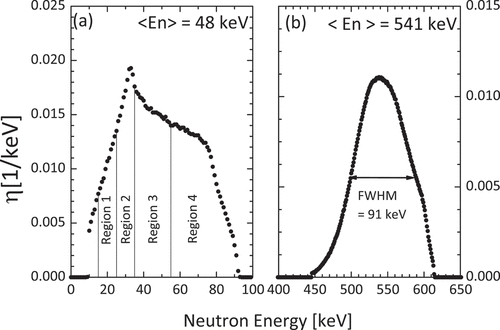
Figure 2. Incident neutron energy spectra, η(En), in the (a) 15–100 keV and (b) 550 keV measurements for 78Se. En indicates an average neutron energy in the laboratory system, see EquationEq. (3).

Figure 2. Incident neutron energy spectra, η(En), in the (a) 15–100 keV and (b) 550 keV measurements for 78Se. En indicates an average neutron energy in the laboratory system, see EquationEq. (3)(3) Enj≡∫Ej,minEj,maxEnη(En)dEn∫Ej,minEj,maxη(En)dEn,(3) .

Figure 3. TOF spectra measured with the γ-ray spectrometer for the (a)78Se, (b)197Au, and (c) blank runs in the 15–100 keV measurement. Regions 1–4 in the figure correspond to those in .
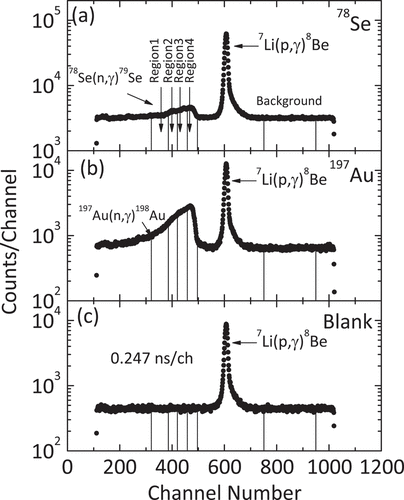
Figure 3. TOF spectra measured with the γ-ray spectrometer for the (a)78Se, (b)197Au, and (c) blank runs in the 15–100 keV measurement. Regions 1–4 in the figure correspond to those in Figure 2(a).

Figure 4. TOF spectra measured with the γ-ray spectrometer for the (a)78Se, (b)197Au, and (c) blank runs in the 550 keV measurements.
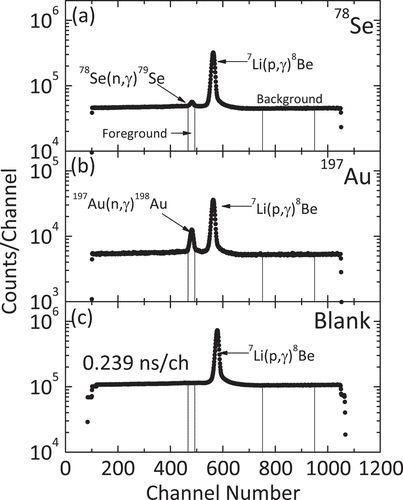
Figure 4. TOF spectra measured with the γ-ray spectrometer for the (a)78Se, (b)197Au, and (c) blank runs in the 550 keV measurements.

Figure 5. Expansion view of TOF spectrum measured with the γ-ray spectrometer for the 82Se in the 15–100 keV measurement. Resonance structures were observed in this spectrum.
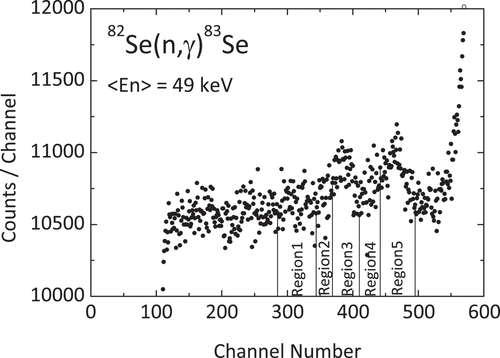
Figure 5. Expansion view of TOF spectrum measured with the γ-ray spectrometer for the 82Se in the 15–100 keV measurement. Resonance structures were observed in this spectrum.

Figure 6. Observed net capture γ-ray PH spectra of 78Se in the incident neutron energy region from 15 to 100 keV (average energy: 48 keV) and around 550 keV. Below 0.6 MeV, constant extrapolation was made.
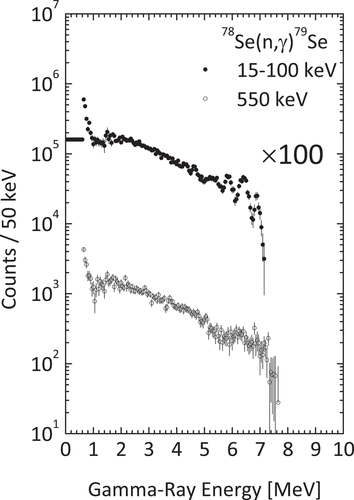
Figure 6. Observed net capture γ-ray PH spectra of 78Se in the incident neutron energy region from 15 to 100 keV (average energy: 48 keV) and around 550 keV. Below 0.6 MeV, constant extrapolation was made.

Figure 7. Observed net capture γ-ray PH spectra of 82Se in the incident neutron energy region from 15 to 100 keV (average energy: 49 keV) and around 550 keV. Below 0.6 MeV, constant extrapolations were made.
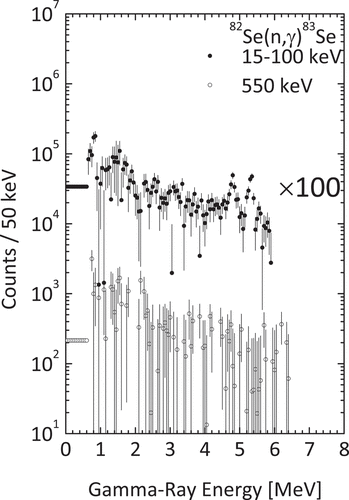
Figure 7. Observed net capture γ-ray PH spectra of 82Se in the incident neutron energy region from 15 to 100 keV (average energy: 49 keV) and around 550 keV. Below 0.6 MeV, constant extrapolations were made.

Table 3. Correction factors for the self-shielding and multiple scattering of neutrons in the sample.

Table 4. Statistical and systematic uncertainties.

Figure 8. Neutron capture cross sections of 74Se in the keV region. The horizontal bars show the energy region in .
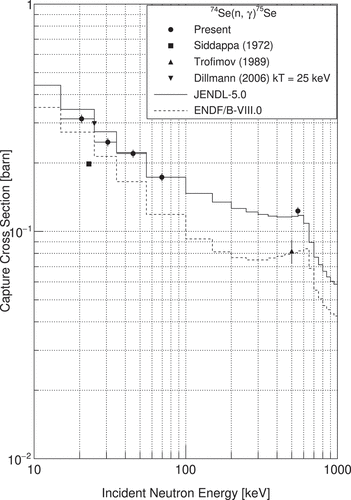
Figure 8. Neutron capture cross sections of 74Se in the keV region. The horizontal bars show the energy region in Table 5.

Figure 9. Neutron capture cross sections of 76Se in the keV region. The horizontal bars show the energy region in .
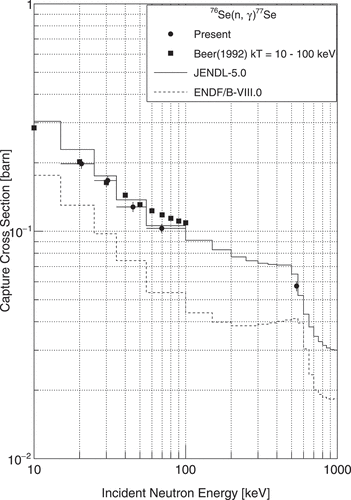
Figure 9. Neutron capture cross sections of 76Se in the keV region. The horizontal bars show the energy region in Table 6.

Figure 10. Neutron capture cross sections of 78Se in the keV region. The horizontal bars show the energy region in .
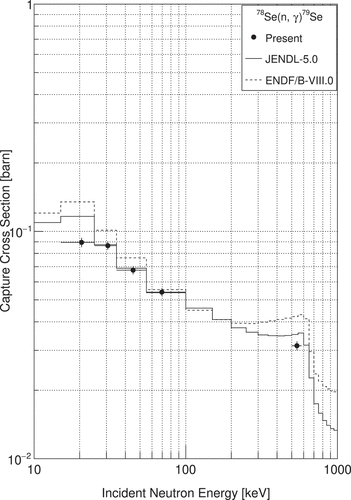
Figure 10. Neutron capture cross sections of 78Se in the keV region. The horizontal bars show the energy region in Table 7.

Figure 11. Neutron capture cross sections of 80Se in the keV region. The horizontal bars show the energy region in .
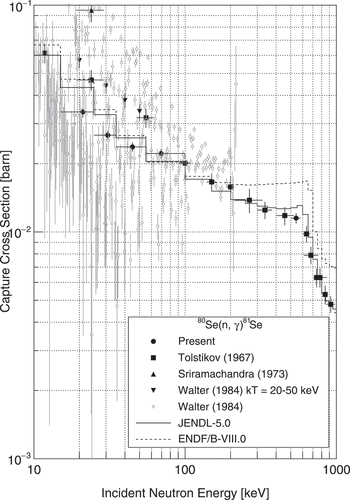
Figure 11. Neutron capture cross sections of 80Se in the keV region. The horizontal bars show the energy region in Table 8.

Table 5. Derived neutron capture cross sections of 74.Se.

Table 6. Derived neutron capture cross sections of 76.Se.

Table 7. Derived neutron capture cross sections of 78.Se.

Table 8. Derived capture cross sections of 80.Se.

Table 9. Derived neutron capture cross sections of 82.Se.

Figure 12. Neutron capture cross sections of 80Se in the keV region. The horizontal bars show the energy region in .
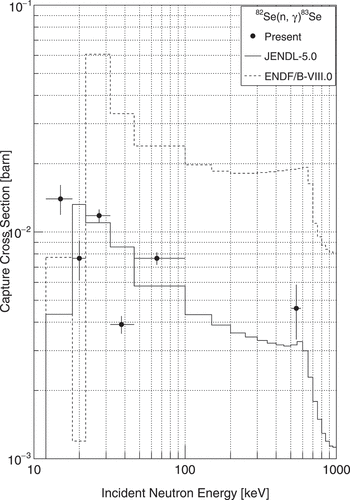
Figure 12. Neutron capture cross sections of 80Se in the keV region. The horizontal bars show the energy region in Table 8.

Figure 13. Neutron capture cross sections of 82Se in the keV region. The horizontal bars show the energy region in .
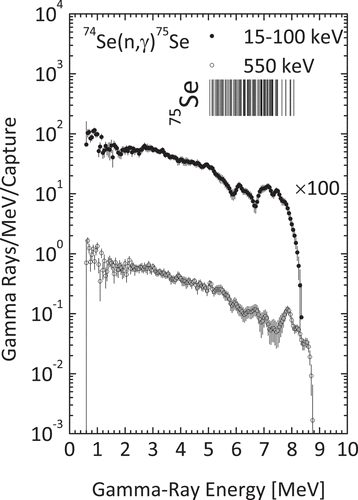
Figure 13. Neutron capture cross sections of 82Se in the keV region. The horizontal bars show the energy region in Table 9.

Figure 14. Obtained capture γ-ray spectra of 74Se in the incident neutron energy region from 15 to 100 keV and around 550 keV. Low-lying states of 75Se are shown as vertical bars. As for the energy positions of states, see the text.
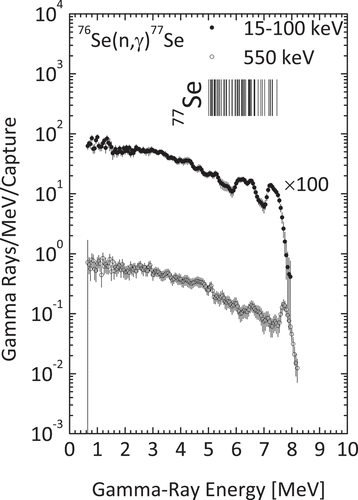
Figure 14. Obtained capture γ-ray spectra of 74Se in the incident neutron energy region from 15 to 100 keV and around 550 keV. Low-lying states of 75Se are shown as vertical bars. As for the energy positions of states, see the text.

Figure 15. Obtained capture γ-ray spectra of 76Se in the incident neutron energy region from 15 to 100 keV and around 550 keV. Low-lying states of 77Se are shown as vertical bars. As for the energy positions of states, see the text.
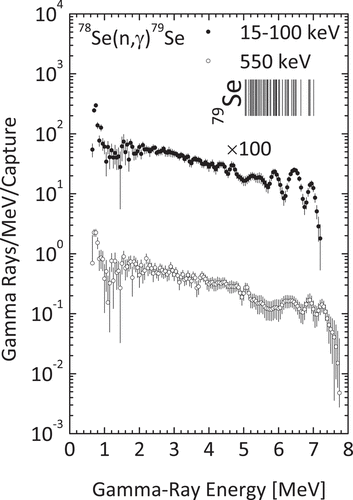
Figure 15. Obtained capture γ-ray spectra of 76Se in the incident neutron energy region from 15 to 100 keV and around 550 keV. Low-lying states of 77Se are shown as vertical bars. As for the energy positions of states, see the text.

Figure 16. Obtained capture γ-ray spectra of 78Se in the incident neutron energy region from 15 to 100 keV and around 550 keV. Low-lying states of 79Se are shown as vertical bars. As for the energy positions of states, see the text.
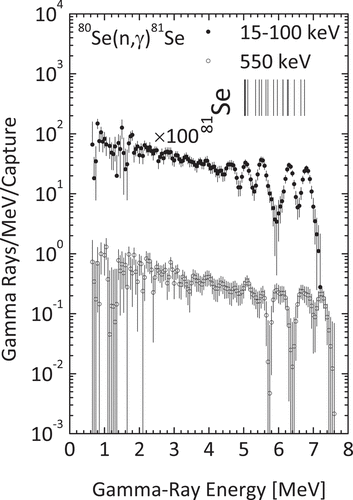
Figure 16. Obtained capture γ-ray spectra of 78Se in the incident neutron energy region from 15 to 100 keV and around 550 keV. Low-lying states of 79Se are shown as vertical bars. As for the energy positions of states, see the text.

Figure 17. Obtained capture γ-ray spectra of 80Se in the incident neutron energy region from 15 to 100 keV and around 550 keV. Low-lying states of 81Se are shown as vertical bars. As for the energy positions of states, see the text.
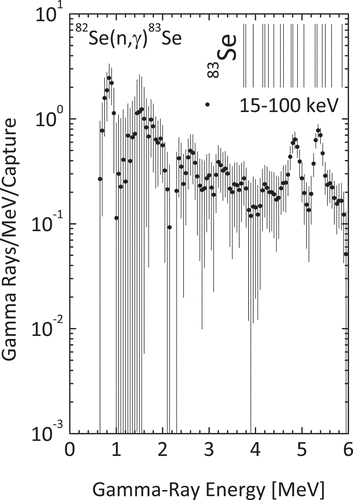
Figure 17. Obtained capture γ-ray spectra of 80Se in the incident neutron energy region from 15 to 100 keV and around 550 keV. Low-lying states of 81Se are shown as vertical bars. As for the energy positions of states, see the text.

Table 10. Multiplicities of observed capture γ-rays (MP:E γ0.6 MeV) and reduced multiplicities.

Table 11. Intensities of primary transitions of the neutron capture of 76.Se.

Table 12. Intensities of primary γ-rays transitions of the neutron capture 78.Se.

Table 13. Intensities of primary γ-ray transitions of neutron capture of 80.Se.

Table 14. Intensities of primary γ-ray transitions of neutron capture of 82.Se.

Reprints and Corporate Permissions

Please note: Selecting permissions does not provide access to the full text of the article, please see our help page How do I view content?

To request a reprint or corporate permissions for this article, please click on the relevant link below:

Academic Permissions

Please note: Selecting permissions does not provide access to the full text of the article, please see our help page How do I view content?

Obtain permissions instantly via Rightslink by clicking on the button below:

If you are unable to obtain permissions via Rightslink, please complete and submit this Permissions form. For more information, please visit our Permissions help page.