
Figures & data

Figure 1. Front and back view of the setup used for radioactive hotspot investigation. The basic elements of iRIS, namely a Compton camera, 3D-LiDAR-based SLAM device, and survey meter, were mounted on a Mecanum wheel robot. The robot carried an overhead camera (for the operator to control the robot while viewing the video) and LED light to illuminate in the dark. All devices installed on the robot were covered with plastic bags to prevent radioactive contamination.
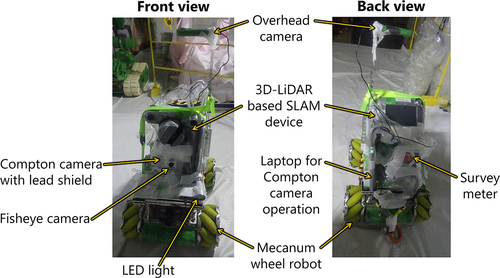
Table 1. Partial specifications of the Mecanum wheel robot used in the hotspot investigation.
Figure 2. Schematic of the top view of the investigation area inside Unit 1 R/B of FDNPS. The robot system travelled from the carry-in entrance of the R/B toward the front of the TIP room at the farthest point. The robot and Compton camera were operated wirelessly and remotely using Wi-Fi from a base station located in the carry-in entrance.
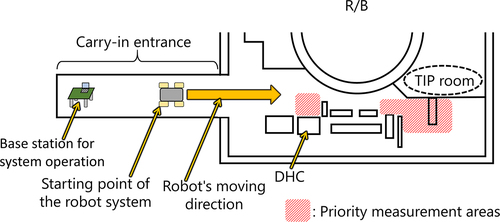
Figure 3. Dose-rate mapping results along the robot’s movement trajectory acquired by SLAM. (a) the robot system moved from the carry-in entrance toward the front of the TIP room, as shown in . Panels (b) and (c) show the vicinity of the DHC system; observations were recorded near the DHC system in the direction of the arrows shown in the enlarged view in panel (a). Panel (d) shows the passageway in front of the TIP room indicated by the arrow in panel (a).
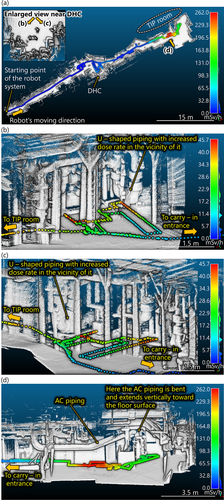
Figure 4. 2D imaging results obtained by the Compton camera near the U-shaped piping installed on the right side of the DHC system. The top panel shows a 3D model of the measurement area viewed from above, with each arrow indicating the approximate locations and measurement directions of the Compton camera. For each view, photographs acquired with the fisheye optical camera attached to the Compton camera (left) and the imaging results of the superimposed hotspot images (right) are shown.
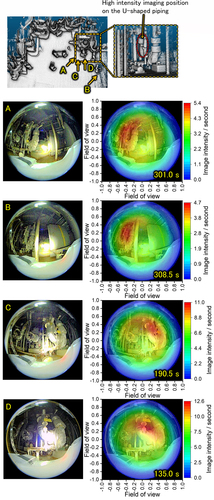
Figure 5. Imaging results of the U-shaped piping on the right side of the DHC acquired with the Compton camera from a greater distance than in .
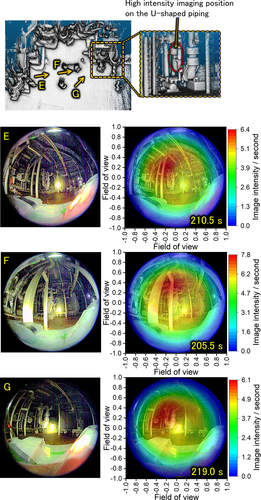
Figure 6. 2D imaging results obtained by the Compton camera near the U-shaped piping installed on the left side of the DHC. The top panel shows a 3D model of the measurement area viewed from above, with each arrow indicating the approximate locations and measurement directions of the Compton camera. For each view, photographs acquired with the fisheye optical camera attached to the Compton camera (left) and the imaging results of the superimposed hotspot images (right) are shown.
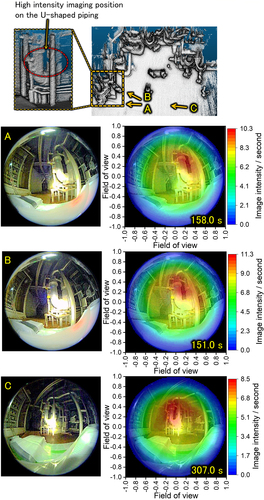
Figure 7. 2D imaging results obtained by the Compton camera near the atmospheric control piping installed in the ceiling in front of the TIP room. The top panel shows a 3D model of the measurement area viewed from above, with each arrow indicating the approximate locations and measurement directions of the Compton camera. The artifact marked on the top panel is a point cloud generated by a robot separately used to monitor the Mecanum wheel robot equipped with the Compton camera.
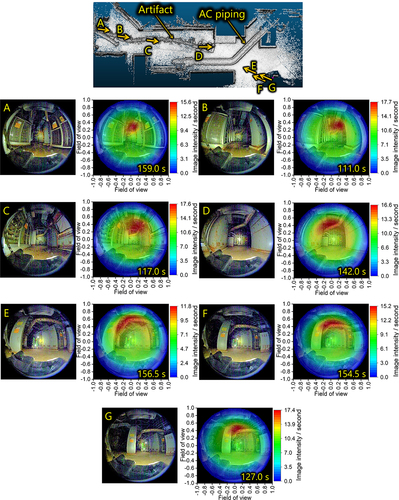
Figure 8. The energy spectrum of the coincidence event between the scatterer and absorber of the Compton camera. This spectrum was acquired at view D in .
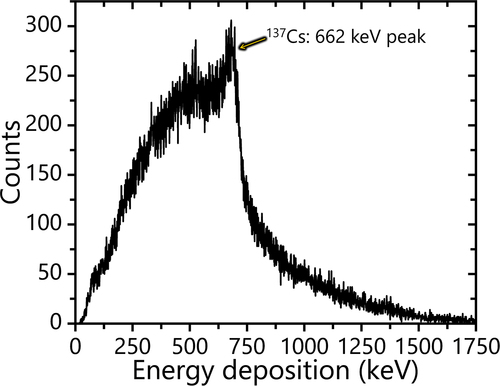
Figure 9. 2D imaging results of the AC piping near the wall in front of the TIP room obtained with the Compton camera. The ceiling AC piping bends at the wall and extends perpendicular to the floor surface.

Figure 10. Schematic illustration of locating and visualizing a radiation source in 3D by combining a Compton camera and simultaneous localization and mapping (SLAM) device. These two devices are mounted on a robot, which can be operated remotely. The position and posture where the Compton camera detected gamma rays were estimated using the SLAM device. Generated Compton cones from multiple viewpoints are projected onto the 3D work environment model generated by SLAM, and the hotspot is identified at the intersection of the Compton cones. This figure is a modified version of Figure 3 from ref [Citation9], which describes the principle of the iRIS.
![Figure 10. Schematic illustration of locating and visualizing a radiation source in 3D by combining a Compton camera and simultaneous localization and mapping (SLAM) device. These two devices are mounted on a robot, which can be operated remotely. The position and posture where the Compton camera detected gamma rays were estimated using the SLAM device. Generated Compton cones from multiple viewpoints are projected onto the 3D work environment model generated by SLAM, and the hotspot is identified at the intersection of the Compton cones. This figure is a modified version of Figure 3 from ref [Citation9], which describes the principle of the iRIS.](/cms/asset/b7ba54c6-aa26-40ed-a446-9772b7ee3692/tnst_a_2282551_f0010_oc.jpg)
Figure 11. Measurements were performed with the Compton camera across the AC piping in the ceiling, and (a) the reconstructed image of the hotspot was compared with (b) the dose-rate data acquired by a survey meter. Panel (b) is a rescaled figure of . The artifact marked on the panel (a) is a point-cloud shape caused by a robot separately used to monitor the Mecanum wheel robot equipped with the Compton camera.
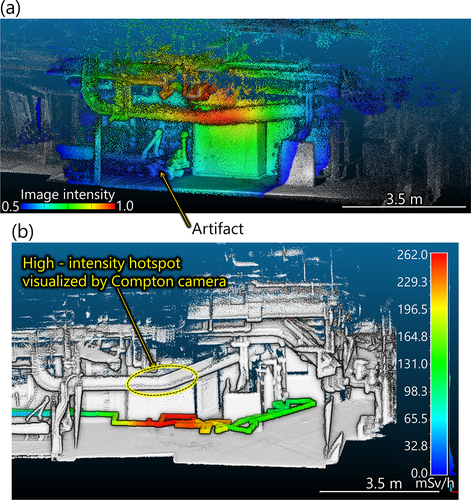
Figure A1. Photograph of the shielded gamma-ray sensor of the Compton camera used for hotspot detection inside Unit 1 R/B of FDNPS. This sensor setup is the same as that used to analyze the radioactive contaminated filter train inside the air conditioning room of Unit 2 R/B; this figure is a reprinted version of Figure A1 from ref [Citation10].
![Figure A1. Photograph of the shielded gamma-ray sensor of the Compton camera used for hotspot detection inside Unit 1 R/B of FDNPS. This sensor setup is the same as that used to analyze the radioactive contaminated filter train inside the air conditioning room of Unit 2 R/B; this figure is a reprinted version of Figure A1 from ref [Citation10].](/cms/asset/457f7339-c51e-4492-a059-05a5e0089d6a/tnst_a_2282551_f0012_oc.jpg)
Figure A2. Relationship between the incidence angle of 662-keV gamma rays into the gamma-ray sensor and the number of coincidence events detected. The number of detections is normalized with 1.0 for the 0° direction. The irradiation dose rate was 3 mGy/h at the 137Cs irradiation facility. This figure is reproduced from ref [Citation10].
![Figure A2. Relationship between the incidence angle of 662-keV gamma rays into the gamma-ray sensor and the number of coincidence events detected. The number of detections is normalized with 1.0 for the 0° direction. The irradiation dose rate was 3 mGy/h at the 137Cs irradiation facility. This figure is reproduced from ref [Citation10].](/cms/asset/abc119d0-141d-4994-881f-b84b1ae1c626/tnst_a_2282551_f0013_b.gif)
Table A1. Performance of the gamma-ray sensor setup of the Compton camera used for hotspot investigation. This table is reproduced from ref [Citation10].