Figures & data
Table 1. The optical model potential parameters.
Table 2. The excited energies (ε), spins (J), parities (π), and deformation parameters (β) of eight discrete levels which make the main contribution to the direct inelastic scattering.
Table 3. The level density and pair correction parameters.
Figure 1. Calculated (n, tot) and (n, el) cross sections (solid line) compared with experimental data (symbols) for n+52Cr reaction.
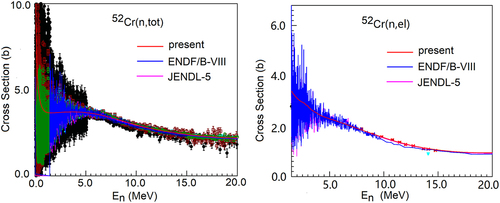
Figure 2. Calculated neutron elastic scattering angular distributions (solid curves) compared with the experimental data (symbols) for incident energy in the range 7.95 to 14.76 MeV and 4.5 to 9.99 MeV. From 7.95 to 14.76 MeV and 4.5 to 9.99 MeV, the results were offset by factors of 10. The data at the top of the figure have not been adjusted.
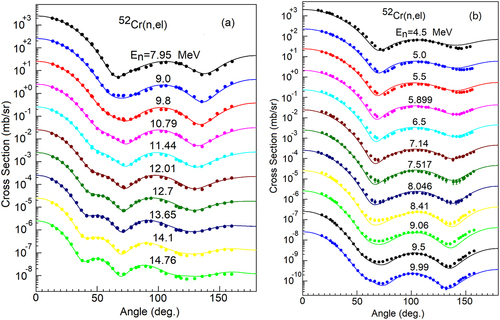
Figure 3. Calculated neutron inelastic scattering angular distributions (solid curves) for the first excited state (1.434 2+) compared with the experimental data (symbols). From 7.95 to 14.76 MeV and 4.5 to 14.8 MeV, the results were offset by factors of 10. The data at the top of the figure have not been adjusted.
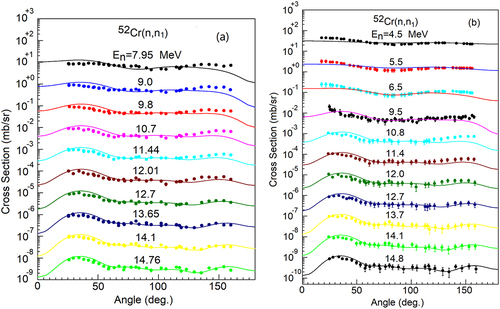
Figure 4. Calculated (n, inl) reaction cross section (solid line) compared with experimental data (symbols) and evaluated data for n+52Cr reaction.
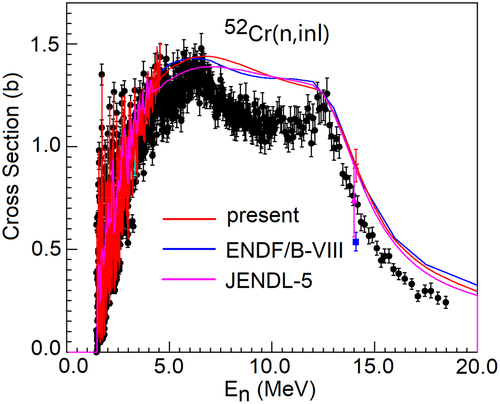
Figure 5. Calculated gamma production cross sections (solid line) for the transition of the first excited state to the ground state, the second excited state to the first excited state and the third excited states to the second excited state of 52Cr compared with experimental data (symbols).
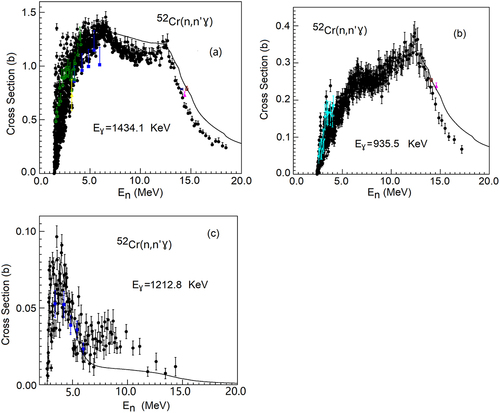
Figure 6. Calculated neutron inelastic scattering cross sections (solid line) of the first excited state, the second excited state, and the third excited state compared with experimental data (symbols) and evaluated data for n+52Cr reaction.
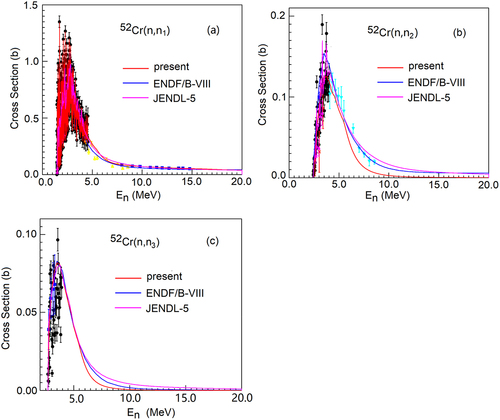
Figure 7. Calculated (n, 2n) reaction cross section (solid line) compared with experimental data (symbols) and evaluated data for n+52Cr reaction.
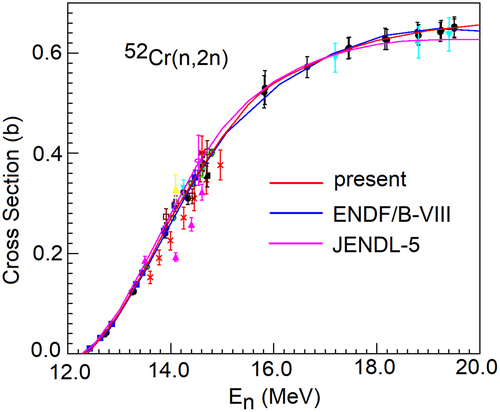
Figure 8. Calculated result of (n,2nɣ) reaction cross section (solid line) compared with the experimental data (symbols) at ɣ-ray energy of 749.1 KeV and 1164.4 KeV.
Figure 9. Calculated (n, p), (n, α), (n, d) reaction cross section (solid line) compared with experimental data (symbols) and evaluated data for n+52Cr reaction.
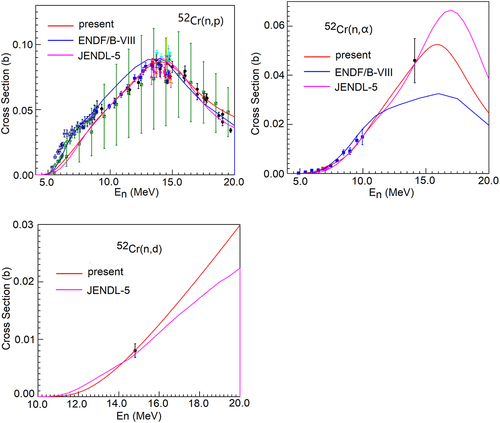
Figure 10. Calculated (n, xn’) double-differential neutron emission cross section (solid line) compared with experimental data (symbols) for different angles at 10.79 MeV, 12.7 MeV and 14.1 MeV incident energy. From 25.0 to 160.0 deg., the results were offset by factors of 10. The data at the top of the figure have not been adjusted.
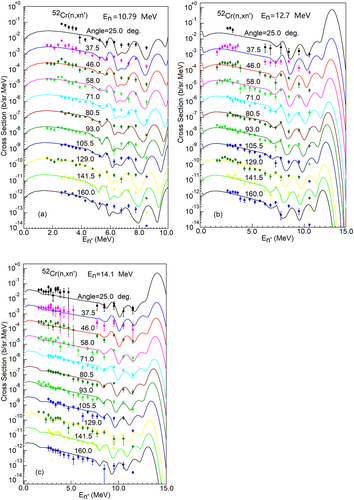
Figure 11. Calculated (n, xn’) double-differential neutron emission cross section (solid line) compared with experimental data (symbols) at incident neutron energy from 13.35 to 14.83 MeV for different angles. From 14.83 to 13.35 MeV, the results were offset by factors of 10. The data at the top of the figure have not been adjusted.
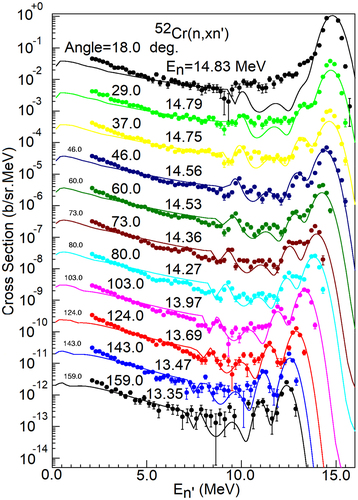
Figure 12. Calculated double-differential neutron emission cross section (solid lines) compared with experimental data (symbols) at incident energy of 14.1 MeV. From 15.0 to 80.0 deg. and 90.0 to 160.0 deg., the results were offset by factors of 10. The data at the top of the figure have not been adjusted.
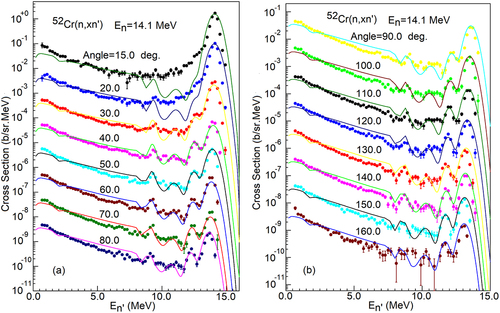
Figure 13. Calculated double-differential neutron emission cross section (solid lines) compared with experimental data (symbols) at incident energy of 14.1 MeV. From 20.0 to 150.0 deg., the results were offset by factors of 10. The data at the top of the figure has not been adjusted.
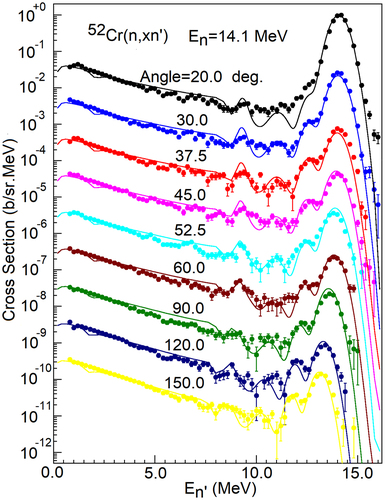
Figure 14. Calculated (n, xn’) neutron emission spectra (solid line) compared with experimental data (symbols) at 7.95, 9.0, 9.8, 10.79, 11.44, 12.01, 12.7, and 14.1 MeV incident energy. From 14.1 to 7.95 MeV, the results were offset by factors of 10. The data at the top of the figure have not been adjusted.
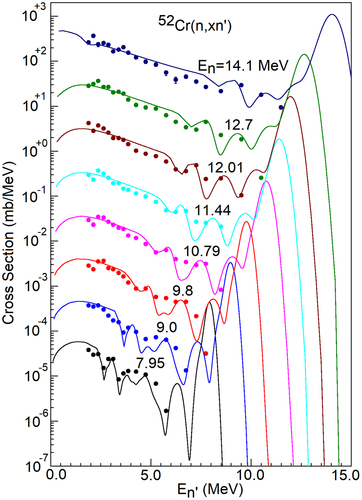
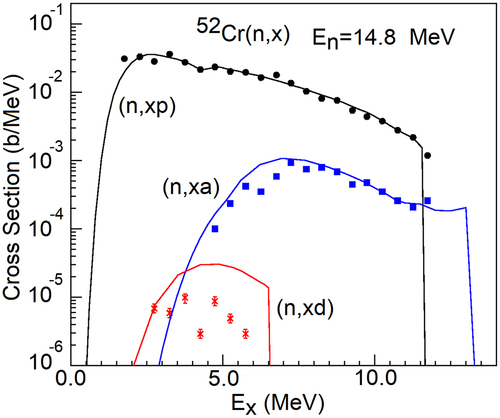
Figure 15. Calculated proton, alpha-particle, and deuteron emission spectra (solid line) compared with experimental data (symbols). From (n, xp) to (n, xd) MeV, the results were offset by factors of 10 except for (n, xp) reaction.