
Figures & data
Table 1. Descriptive statistics for the SWLS-3 and the HILS-3 scales and items.
Table 2. Pearson’s correlations among the scales.
Figure 1. Standardized regression weights for the two-factor model of the Harmony in life (HIL) and the Satisfaction with life (SWL) three-item scales in three different datasets. The first row is Dataset 1 (N = 787); the second row Dataset 2 (N = 860), and the third row Dataset 3 (N = 343). The factor loading of the first item of each latent construct was set to 1.0 to identify the models.
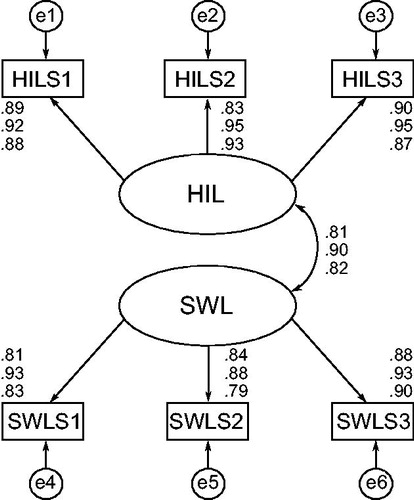
Table 3. CFA results of the SWLS and the HILS show that a 2-factor solution with the shorter scales yield the best fit.
Table 4. Results from longitudinal measurement invariance analyses of the SWLS.
Table 5. Results from longitudinal measurement invariance analyses of the HILS.
Table 6. Test-retest reliability for the scales.
Table 7. Results from Measurement Invariance Analyses of the SWLS Across Gender.
Table 8. Results from measurement invariance analyses of the HILS across gender.
Table 9. Pearson’s r correlation comparisons between three- and five-item scales in dataset 1.
Table 10. Pearson’s r correlation comparisons between three- and five-item scales in dataset 2.