Figures & data
Table 1. Descriptive Statistics and Zero-Order Correlation Matrix for the Indicators (N = 228).
Figure 1. Path Coefficients for the Moderation Effect of Prevention-Focus on the Relationships Between Insecure Attachment and Depression. Note. Unstandardized regression coefficients were used for the path coefficients. Covariance estimates for extraneous variables were not provided for the presentation purpose.
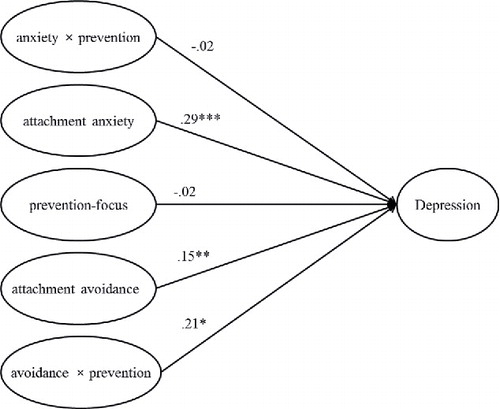
Table 2. Path Coefficients for the Moderation Effect of Prevention-Focus on Depression.
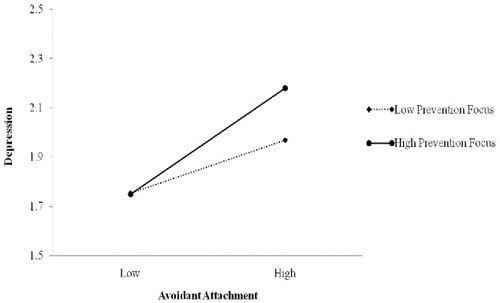
Figure 2. The Moderating Effect of Prevention-Focus on the Relation Between Avoidant Attachment and Depression.