Figures & data
Table 1. The PRC scheme using an initial conjugate prior in a power prior, for some of the univariate distributions typically used in SPC/M, belonging to the k-PREF.
Figure 1. PRC flowchart 1. A parallelogram corresponds to an input/output information, a decision is represented by a rhombus and a rectangle denotes an operation after a decision making. In addition, the rounded rectangles indicate the beginning and end of the process.
For the likelihoods with two unknown parameters and total prior ignorance (i.e. initial reference prior and
in the power prior) we need n = 3 to initiate PRC, while for all other cases, PRC starts right after x1 becomes available.
![Figure 1. PRC flowchart 1. A parallelogram corresponds to an input/output information, a decision is represented by a rhombus and a rectangle denotes an operation after a decision making. In addition, the rounded rectangles indicate the beginning and end of the process.★For the likelihoods with two unknown parameters and total prior ignorance (i.e. initial reference prior and α0=0 in the power prior) we need n = 3 to initiate PRC, while for all other cases, PRC starts right after x1 becomes available.](/cms/asset/9b467844-5d27-429b-ab0b-98c8c176c49a/ujqt_a_2161434_f0001_c.jpg)
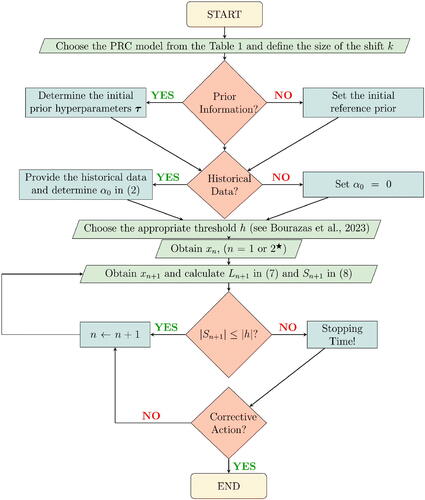
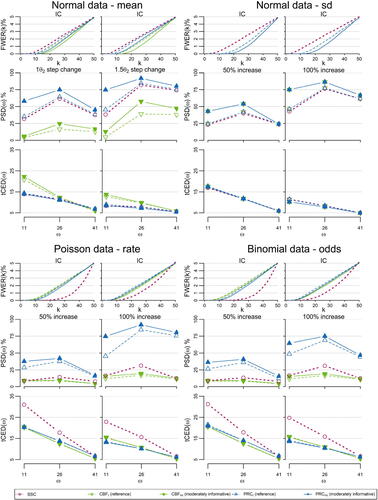
Figure 2. The FWER(k) at each time point the probability of successful detection,
and the truncated conditional expected delay,
for shifts at locations
of SSC, CBF and PRC, under a reference (CBFr, PRCr) or a moderately informative (CBFmi, PRCmi) prior. The results refer to Normal data with step changes for the mean of size
Normal data with inflated standard deviation of size
Poisson data with rate increase of size
and Binomial data with increase for the odds of size
![Figure 2. The FWER(k) at each time point k=2,3,…,50, the probability of successful detection, PSD(ω) and the truncated conditional expected delay, tCED(ω) for shifts at locations ω={11,26,41}, of SSC, CBF and PRC, under a reference (CBFr, PRCr) or a moderately informative (CBFmi, PRCmi) prior. The results refer to Normal data with step changes for the mean of size {1θ2,1.5θ2}, Normal data with inflated standard deviation of size {50%,100%}, Poisson data with rate increase of size {50%,100%} and Binomial data with increase for the odds of size {50%,100%}.](/cms/asset/8a0d97be-56f8-406f-b6b4-dc03aad33dd9/ujqt_a_2161434_f0002_c.jpg)