Figures & data
Table 1. The expected ratio of the variance of the likelihood over the variance of the marginal
defined in (Equation11
[11]
[11] ).
Figure 1. Determining the decision threshold h for a predictive ratio cusum (PRC) scheme. A decision is represented by a rhombus, and a rectangle corresponds to an operation after a decision is made.
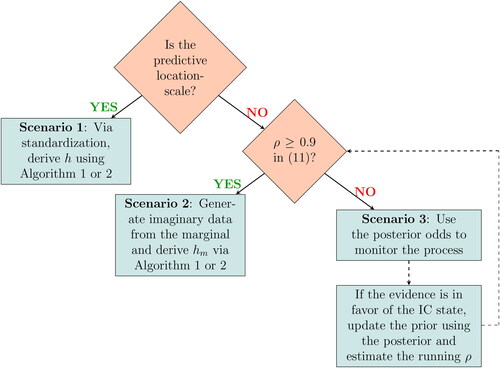
Figure 2. Predictive ratio cusum (PRC) flowchart 2. A parallelogram corresponds to an input/output information, a decision is represented by a rhombus, and a rectangle denotes an operation after a decision-making. In addition, the rounded rectangles indicate the beginning and end of the process. *For the likelihoods with two unknown parameters and total prior ignorance (i.e., initial reference prior and in the power prior), we need n = 3 to initiate PRC, while for all other cases, PRC starts right after x1 becomes available.
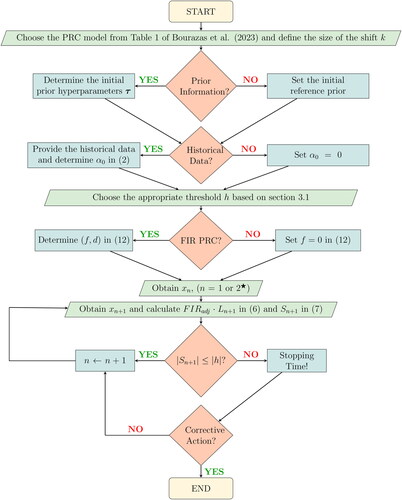
Figure 3. The family-wise error rate FWER(k) at each time point the probability of successful detection, probability of successful detection
and the truncated conditional expected delay, truncated conditional expected delay
for shifts at locations
of self-starting cusum SSC, cumulative Bayes factor CBF and PRC, under a reference (CBFr, PRCr) or a moderately informative (CBFmi, PRCmi) prior for OOC scenarios with misspecified likelihood. All the procedures are set for a mean step change size of
in data from a standard Normal or an rate increase of 50% in P(1) data.
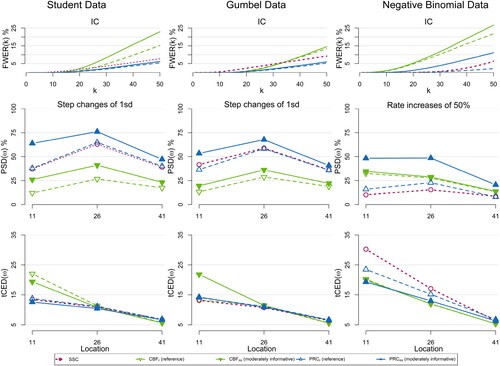
Figure 4. The and
for shifts at locations
of SSC, CBF and PRC, under a reference (CBFr, PRCr) or a moderately informative (CBFmi, PRCmi) prior for OOC scenarios with misspecified jumps. All the procedures are set for a mean step change of size
in data from a standard normal distribution.
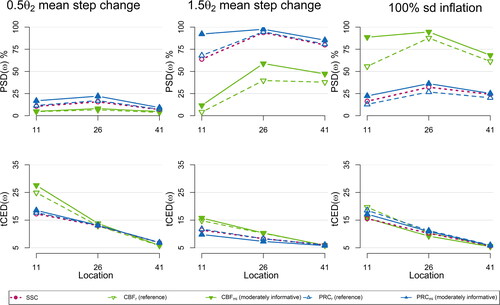
Figure 5. The FWER(k) at each time point
and
for shifts at locations
of PRC under two misplaced moderately informative priors in the negative and positive directions (
and
respectively), along with the and CBF under the same priors (
and
). All the methods are set for detecting a positive mean step change of size
in normal data.
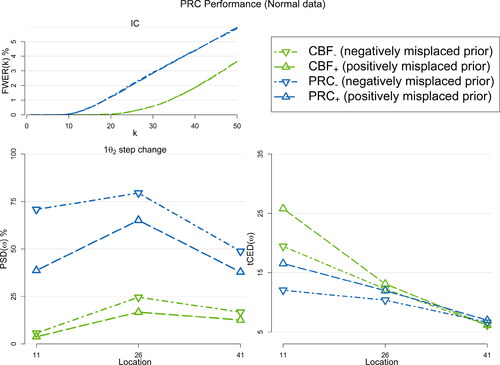
Figure 6. The and
for shifts at locations
of SSC, CBF, and PRC, under a reference (CBFr, PRCr) or a moderately informative (CBFmi, PRCmi) prior for OOC scenarios with dependent data. All the procedures are set for a mean step change of size
for the mean or 50% inflation for the standard deviation in data from a standard normal distribution.
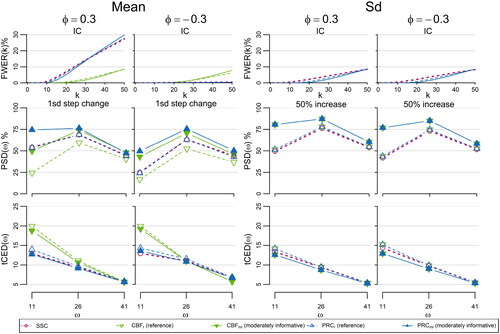
Table 2. The Factor V (%) internal quality control observations of the current data, reported during September 24, 2019–October 8, 2019.
Figure 7. Predictive ratio cusum (PRC) for normal data. At the top panel, the data are plotted, while at the lower panel, we provide the PRC control chart, focused on detecting an upward or downward mean step change of one standard deviation size, when we aim a for 21 observations.
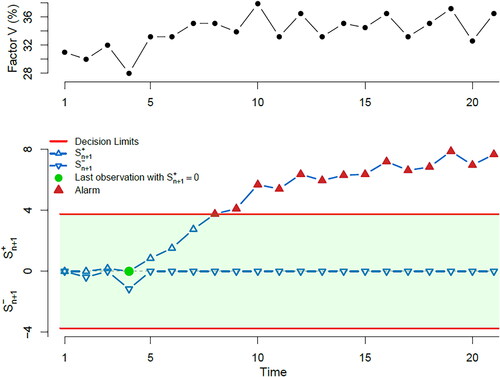
Table 3. Counts of adverse events (xi) and product exposure (si) per million (), for each quarter reported during July 1, 1999–December 31, 2004 (see Dong, Hedayat, and Sinha Citation2008).
Figure 8. Predictive ratio cusum (PRC) for Poisson data. At the top panel, we plot the counts of adverse events xi (solid line) and the rate of adverse events per million units (dashed line). At the lower panel, we provide the PRC control chart, focused on detecting 100% rate inflation and the evidence based limit of
is used. For the fast initial response (FIR)-PRC (dashed line) the parameters
were used.
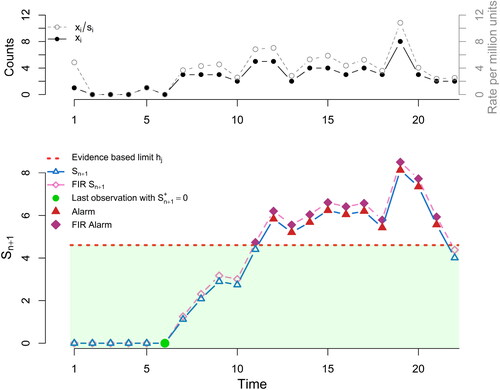
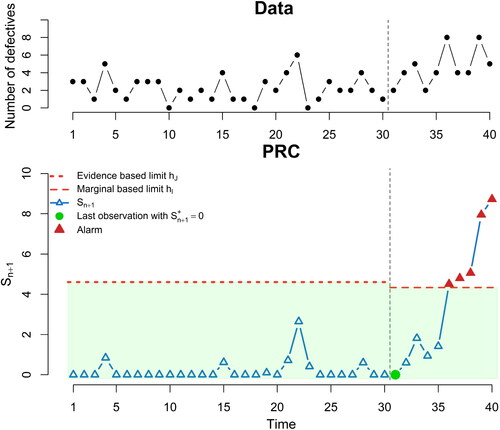
Table 4. The sequence of the data representing the number of defective per 50 sampled shipping papers.
Figure 9. Predictive ratio cusum (PRC) for binomial data. At the top panel, we plot the number of defective shipping papers xi, while at the lower panel, we provide the PRC control chart, focused on detecting 100% odds inflation. The evidence based limit of is used for the first 30 observations, and then these data are used for the derivation of the decision limit
setting the average run length