Figures & data
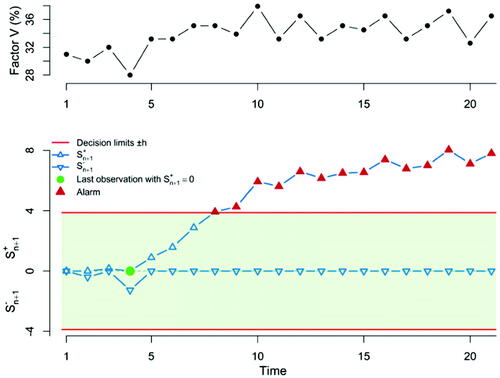
Figure 7. Predictive ratio cusum (PRC) for normal data. At the top panel, the data are plotted, while at the lower panel, we provide the PRC control chart focused on detecting an upward or downward mean step change of on standard deviation size, when we a FWER = 5% for 21 observations.