
Figures & data
Table 1. Sexually active population demographics
Table 2. Percentage of sexually active men and women reporting sexual function problems for at least three months in the last year and proportion reporting problems meeting DSM-5 morbidity criteria
Figure 1. Prevalence of sexual function problems meeting DSM-5 morbidity criteria in the last year by gender and age group, among the sexually active participants.
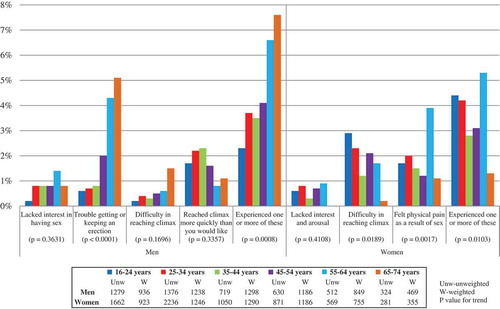
Table 3a Overlap between reported sexual function problems meeting DSM-5 morbidity criteria: Sexually active men
Table 3b. Overlap between reported sexual function problems meeting DSM-5 morbidity criteria: Sexually active women
Table 4. Associations between sexual function problems meeting DSM-5 morbidity criteria and factors relevant to etiology and management
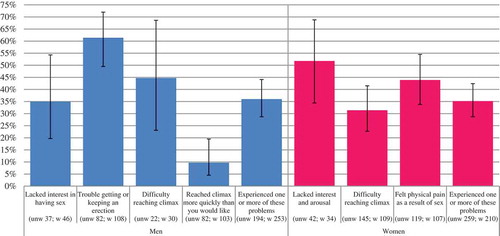
Figure 2. Proportion of men and women with sexual function problems meeting DSM-5 morbidity criteria who sought professional help in the last year.
Box 1. Criteria for sexual function problems: Comparison of Natsal-3 survey and DSM-5
