Figures & data
Table 1. Analysis of Variance (ANOVA) for the Multi-Gender Identity Questionnaire Variables
Table 2. Cohen’s d for Significant Comparisons Between Gender and Sex-Gender Configuration Categories
Figure 1. (a–b) Scatter plots and (c) mean and standard deviation of feeling as a man (x-axis) and feeling as a woman (y-axis) in the three gender groups (marked in different colors) in male-assigned (a), female-assigned (b), and all (c) participants. (d–e) Scatter plots and (f) mean and standard deviation of feeling as both genders (x-axis) and feeling as neither gender (y-axis) in the three gender groups in male-assigned (d), female-assigned (e), and all (f) participants. The size of each circle is proportional to the percent of individuals from a given gender category with an identical score on the two measures.
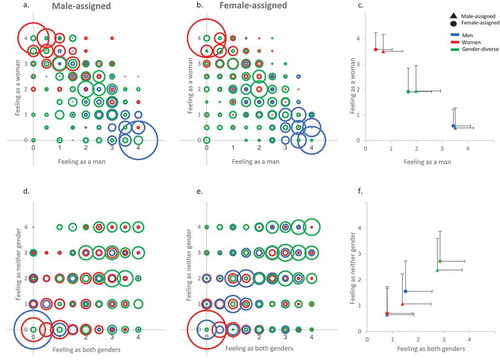
Figure 2. Scatter plots of the nonbinary score in the six sex-gender configuration groups. The size of each circle is proportional to the percent of individuals from a given gender category with an identical score.
Figure 3. (a–b) Scatter plots and (c) mean and standard deviation of satisfied being the affirmed gender (x-axis) and wish to be the “other” gender (y-axis) in the three gender groups (marked in different colors) in male-assigned (a), female-assigned (b), and all (c) participants. (d–e) Scatter plots and (f) mean and standard deviation of dislike of the body due to its sexed form (x-axis) and wish to have the body of the “other” sex (y-axis) in the three gender groups in male-assigned (d), female-assigned (e), and all (f) participants. The size of each circle is proportional to the percent of individuals from a given gender category with an identical score on the two measures.
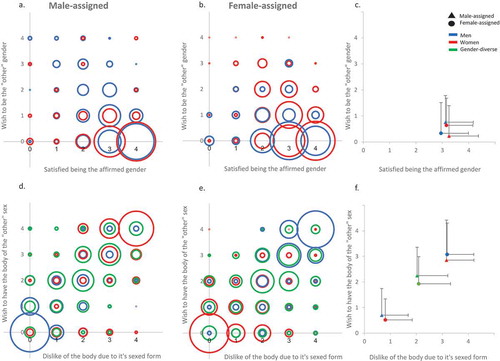
Figure 4. (a–c) Scatter plots and (d) mean and standard deviation of feeling as a “real” man (x-axis) and feeling as a “real” woman (y-axis) in the three gender groups in male-assigned and female-assigned participants (marked in different colors). The size of each circle is proportional to the percent of individuals from a given gender category with an identical score on the two measures.
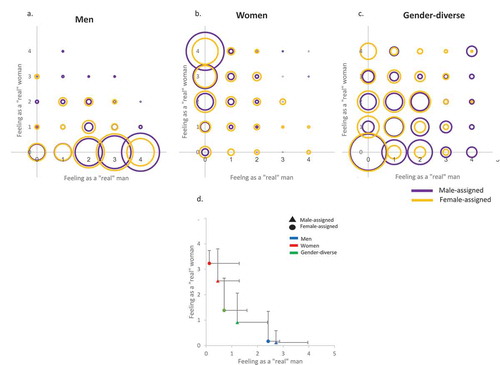
Figure 5. A comparison of a principal component analysis of all the variables from the Multi-GIQ and sexuality questionnaires in the six sex-gender configuration groups. Parallel components are marked in an identical color.