Figures & data
Table 1. Asexual Identification Scale (AIS) scores, sexual attraction, and romantic attraction scores toward same and other sex partners for the different sexual orientation groups. Higher attraction scores indicate stronger sexual or romantic attraction.
Figure 1. Left panel: Asexual identification score distribution across the sample. Higher AIS scores indicate less sexual attraction while lower scores indicate stronger sexual attraction. Small circles indicate individual data, filled squares with error bars indicate group means with 95% CIs. Color-mapping refers to self-identified sexual orientation groups. Dashed lines indicate the lowest and highest possible value as well as the cutoff value suggested by Yule et al. (Citation2015) to differentiate between allo- and asexual individuals. Right panel: Sexual and romantic attraction strength toward men and women for the different groups based on self-reported sexual orientation. Each data point indicates one individual. Values closer to the origin indicate lower attraction ratings. Data that falls within the upper right quadrant indicates stronger sexual and romantic attraction to women. Data that falls within the lower left quadrant indicates stronger sexual and romantic attraction to men. Data that falls within the upper left or lower right quadrant indicates cases in which sexual and romantic orientation directionality are misaligned. A small jitter was introduced to each data point to reduce the degree of overlap and increase visibility.
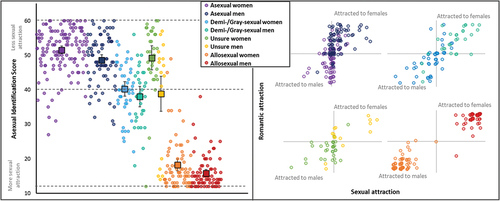
Figure 2. Marginal effects of importance ratings for the different partner characteristics, plotted against AIS scores for men and women separately. Shaded areas indicate CI95. Note that the scale has been adjusted for each partner characteristic to facilitate visualization of the reported effects, and overall importance ratings differ between the traits.
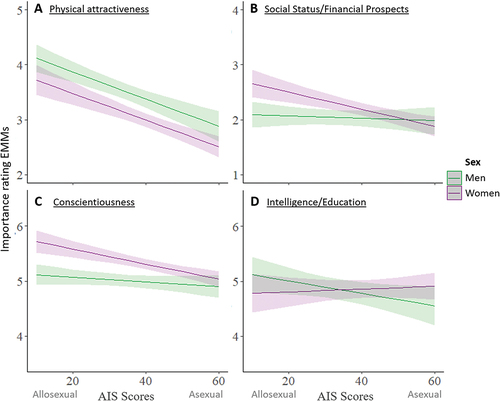
Table 2. Model parameter estimates for best predictor selection, split for the four partner characteristics: Standardized coefficients, including their 95% CIs, change in marginal and conditional R2 and change in AIC between the simple additive and interaction models. Bolded numbers represent the model that explains sex differences in the preferences for the respective partner characteristics best, indicated by larger ΔR2 and more negative ΔAIC.
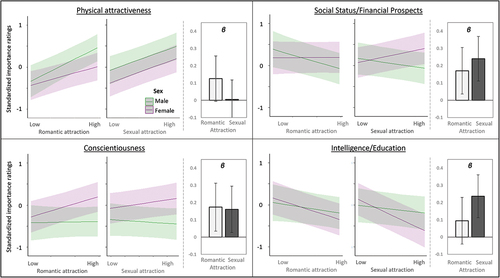
Figure 3. Estimated marginal means of standardized importance ratings of the four partner characteristics, split by participant sex and presented for the two predictors, romantic and sexual attraction, separately. Shaded areas indicate CI95. Bar graphs to the right of each figure indicate the interaction coefficients of each model, indicating the strength of romantic and sexual attraction effects on sex differences in partner preferences. Error bars indicate CI95.