
Figures & data
Figure 1. Short-term mating behaviors of males and females after 1,000 time steps in the model when sex differences existed in mating preferences.
Violin plots summarizing the outcome variables separately for heterosexual individuals and gay males and lesbian females. Plot (A) shows the average number of short-term mating experiences, and plot (B) shows the average number of short-term mates. Central points show mean values and whiskers represent standard errors, but the standard errors are small and overlap to form a single bar. The means were calculated using the full population of males and females in the model (Nmale = Nfemale = 150).
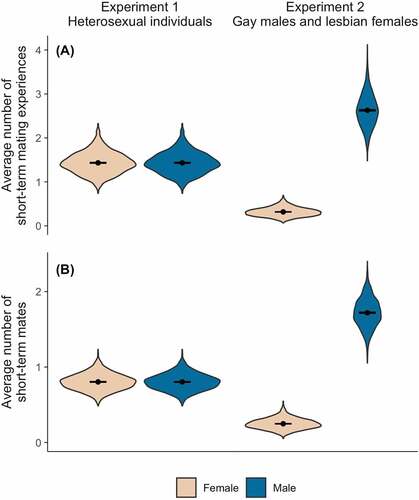
Figure 2. Short-term mating behaviors of heterosexual males and females in the mating pool after 1,000 time steps in the model when sex differences existed in mating preferences.
Violin plots summarizing the outcome variables. Plot (A) shows the average number of short-term mating experiences in the mating pool, and plot (B) shows the average number of short-term mates in the mating pool. Central points show mean values and whiskers represent standard errors, but the standard errors are small and overlap to form a single bar. The means were calculated using the population of heterosexual males and females who successfully participated in the mating pool (mean proportion: Mmale = 0.38, Mfemale = 0.51).
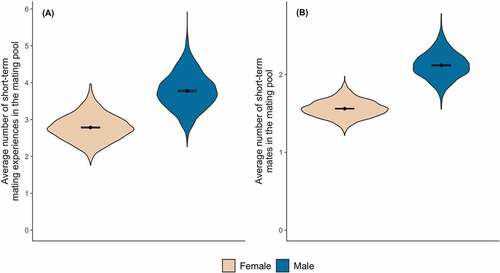
Figure 3. Short-term mating behaviors of heterosexual males and gay males after 1,000 time steps in the model when sex differences existed in mating preferences.
Violin plots summarizing the outcome variables. Plot (A) shows the average number of short-term mating experiences, and plot (B) shows the average number of short-term mates. Central points show mean values and whiskers represent standard errors, but the standard errors are small and overlap to form a single bar. The means were calculated using the full population of heterosexual males and gay males in the model (Nhetero = Ngay = 150).
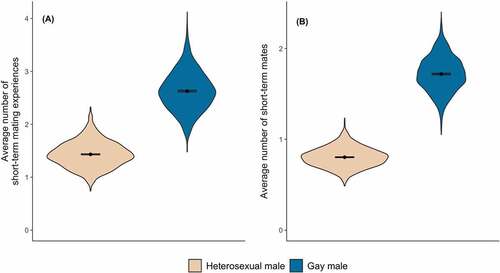
Table 1. Short-term mating behaviors of heterosexual males and females in the mating pool after 1,000 time steps in the model.
Table 2. Short-term mating behaviors of gay males and lesbian females after 1,000 time steps in the model.
Supplemental material