
Figures & data
Table 1. Expected valences of relationships in the network.
Table 2. Demographic description of the sample by gender.
Table 3. Descriptive statistics of the study variables.
Figure 1. Network models. Note. Models W1 (Model 1 for women) and M1 (Model 1 for men) include all sex-related variables, except for the ageist sexual stereotypes. Models W2 (Model 2 for women) and M2 (Model 2 for men) were estimated with the ageist sexual stereotypes variable. (1) relationship satisfaction; (2) satisfaction with the frequency of sex; (3) frequency of sexual intercourse; (4) sexual difficulties; (5) subjective health; (6) importance of sex; and (7) the ageist stereotypes.
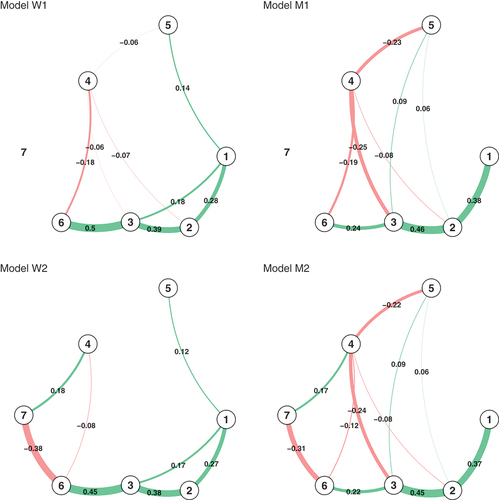
Figure 2. Centrality indices.
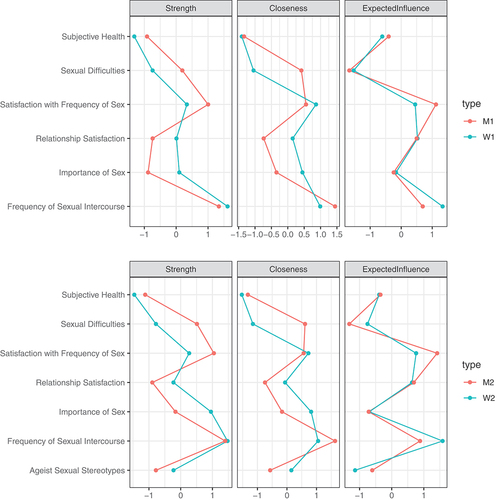
Figure 3. Centrality indices.
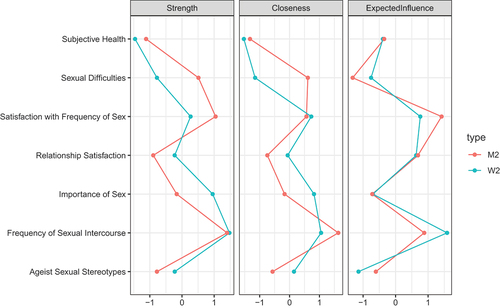
Table 4. Expected valences of relationships in the network (lower triangle) and obtained relationships in the networks (upper triangle).