Figures & data
Figure 1. Theoretical model linking marginalization and loneliness.
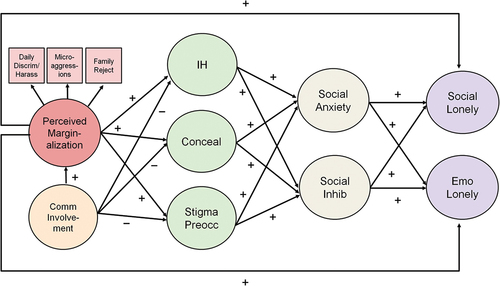
Table 1. Demographic characteristics.
Figure 2. Age differences in adjusted means with robust 95% confidence intervals. Note: For everyday discrimination/harassment, microaggressions, family rejection, and internalized homonegativity, 95% CIs may not be symmetric around the mean because they were back-transformed from log-10 values. All group means were adjusted for gender identity, sexual orientation, ethnoracial identity, geographic region, and urbanicity.
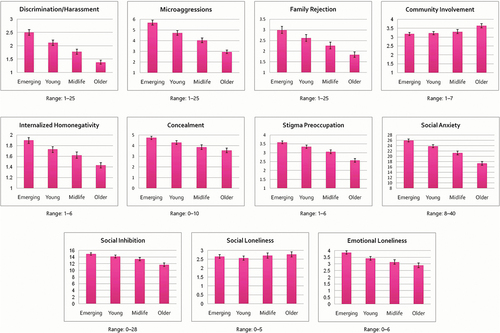
Table 2. Total and direct associations from final partially invariant multigroup Model G.
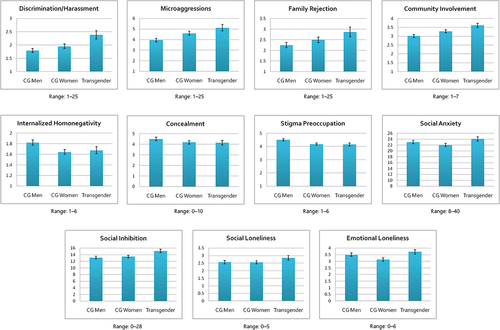
Figure 3. Gender differences in adjusted means with robust 95% confidence intervals. Notes: CG = cisgender. For everyday discrimination/harassment, microaggressions, family rejection, and internalized homonegativity, confidence intervals may not be symmetric around the mean because they were back-transformed from log-10 values. All group means were adjusted for age (continuous), sexual orientation, ethnoracial identity, geographic region, and urbanicity.