Figures & data
Figure 1. The wage share in private non-construction and wage bills of government and construction sectors, relative to NDP, in 1900–2016.
Sources: See text.
Figure 2. Fixed investment in housing and government infrastructure, and the construction wage bill, relative to NDP, in 1900–2016.
Sources: See text.
Table 1. Model overview.
Table 2. Descriptive statistics.
Table 3. Unit root tests.
Table 4. VAR diagnostics.
Table 5. Cointegration tests.
Table 6. Long-run coefficients.
Table 7. Short-run, speed of adjustment coefficients.
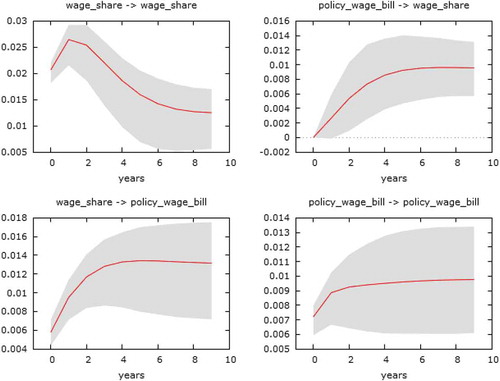
Figure 3. IRFs model 1a.
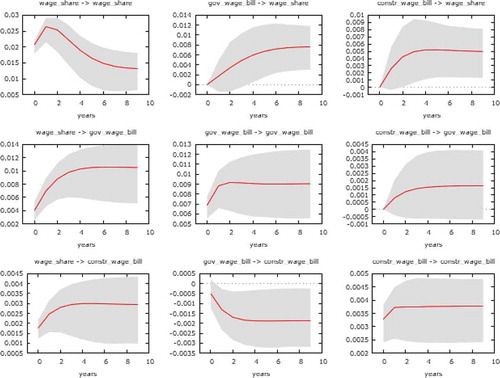
Figure 4. IRFs model 2a.