Publication Cover
Molecular Physics
An International Journal at the Interface Between Chemistry and Physics
Volume 111, 2013 - Issue 18-19: Modern EPR Spectroscopy
1,171
Views
33
CrossRef citations to date
0
Altmetric
Invited Articles

PELDOR in rotationally symmetric homo-oligomers

, , , &
Pages 2845-2854 | Received 14 Mar 2013, Accepted 12 Apr 2013, Published online: 30 May 2013

Figures & data

Figure 1. Simulations of symmetric multi-spin systems arranged as regular convex polygon from triangle to octagon with the polygon type depicted to the right. The time domain data are depicted to the left. Black traces explicitly treat all coupled spins via product formation, whereas grey traces are calculated neglecting multi-spin effects exclusively assuming spin pairs. Distance domain data is shown to the right of the respective time trace; the ‘true’ spin–spin distance distribution resulting from polygon type and vertex displacement is depicted as black dotted lines. Distance domain data by TR are depicted in black and grey in accordance with the respective time traces. All polygon diameters (d) are 5 nm. Vertices are displaced in plane with a standard deviation (σ) of 0.1 nm. The probability of exciting a coupled spin (λ) is 0.5.
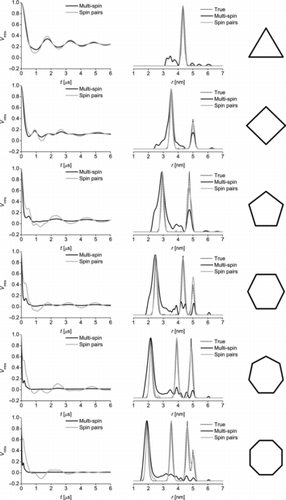
Figure 1. Simulations of symmetric multi-spin systems arranged as regular convex polygon from triangle to octagon with the polygon type depicted to the right. The time domain data are depicted to the left. Black traces explicitly treat all coupled spins via product formation, whereas grey traces are calculated neglecting multi-spin effects exclusively assuming spin pairs. Distance domain data is shown to the right of the respective time trace; the ‘true’ spin–spin distance distribution resulting from polygon type and vertex displacement is depicted as black dotted lines. Distance domain data by TR are depicted in black and grey in accordance with the respective time traces. All polygon diameters (d) are 5 nm. Vertices are displaced in plane with a standard deviation (σ) of 0.1 nm. The probability of exciting a coupled spin (λ) is 0.5.

Table 1. RMSD between ‘true’ distance distributions and those by TR.

Figure 2. Simulations of different vertex displacements in a triangular model of d = 6 nm. Standard deviation of vertex displacement is (from top to bottom) 0.12, 0.3 and 0.6 nm, λ = 0.4, otherwise colours and order of panels is similar to Figure 1.
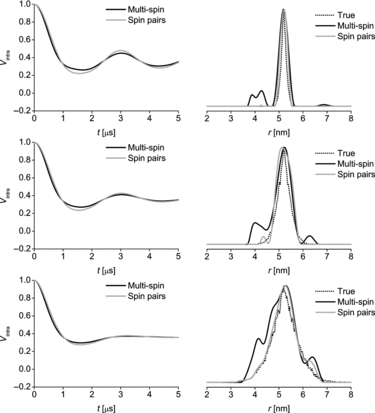
Figure 2. Simulations of different vertex displacements in a triangular model of d = 6 nm. Standard deviation of vertex displacement is (from top to bottom) 0.12, 0.3 and 0.6 nm, λ = 0.4, otherwise colours and order of panels is similar to Figure 1.

Figure 3. Simulations of different vertex displacements in a heptagon system. For all other details see Figure 2.
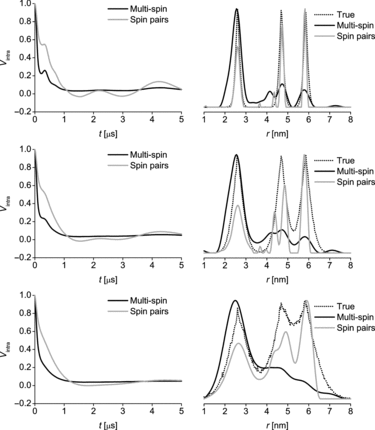
Figure 3. Simulations of different vertex displacements in a heptagon system. For all other details see Figure 2.

Figure 4. Analysis of simulated data of an octagon with d = 6 nm, λ = 0.4 and varying standard deviation of vertex displacement of 0.12 (left), 0.3 (middle) and 0.6 nm (right). ‘True’ distance distribution in black dots, ‘fit’ in light grey and ‘multi-spin’ TR in black solid lines (for details see the main text).

Figure 4. Analysis of simulated data of an octagon with d = 6 nm, λ = 0.4 and varying standard deviation of vertex displacement of 0.12 (left), 0.3 (middle) and 0.6 nm (right). ‘True’ distance distribution in black dots, ‘fit’ in light grey and ‘multi-spin’ TR in black solid lines (for details see the main text).

Figure 5. Analysis of the spin-labelled S147C mutant of MscS. Time domain data is depicted in the left panel; experimental data is given in as black dotted line, time trace based on TR as black solid line and time trace based on fit results as grey solid line. The distance domain data is shown to the right. Results from TR are given as black solid line, distance distribution from heptagon fit as grey solid line and modelling based on the crystal structure as black dotted line.
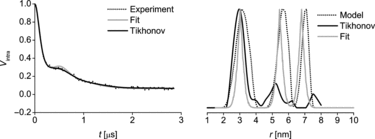
Figure 5. Analysis of the spin-labelled S147C mutant of MscS. Time domain data is depicted in the left panel; experimental data is given in as black dotted line, time trace based on TR as black solid line and time trace based on fit results as grey solid line. The distance domain data is shown to the right. Results from TR are given as black solid line, distance distribution from heptagon fit as grey solid line and modelling based on the crystal structure as black dotted line.
Supplemental material

Supplementary material

Download MS Word (1.3 MB)