Figures & data
Figure 1. New features implemented in mtsslWizard. (A) Structures of the four newly included spin labels. (B) Examples for the use of the spin labels listed in (A). The dashed red line between the PROXYL and URIP labels represents the average distance between these two ensembles. The old version of the program showed all possible distances as lines, which resulted in screen cluttering.
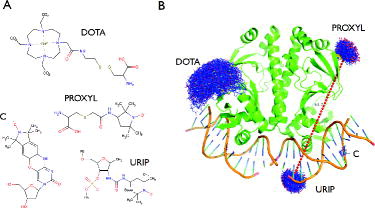
Figure 2. Benchmarking of mtsslWizard. (A) Comparison of version (1.0) of mtsslWizard (grey boxes) with version (1.1) (white circles). Experimental distances that were included in the benchmark data-set of the original mtssWizard paper are plotted against predictions of versions (1.0) and (1.1) of mtsslWizard. The x-axis shows the experimental distance and the y-axis shows the difference of the experimental value to the prediction. The ideal y = 0 line is marked in red, the areas corresponding to different prediction errors are shaded with different colours (green: <3 Å, yellow: ≤5 Å and white: >5 Å). (B) Comparison of experimental distance distributions of the PROXYL-labelled light harvesting complex II (black line, digitised from [Citation12], PDB-ID: 2BHW) with mtsslWizard predictions (red line). (C) Example for the use of the URIP label. The experimental distance distribution is shown in black and the prediction based on the model shown in the inset is shown in red. (D) Example for the use of the C spin label. The experimental distance distribution (black) was constructed using data from [Citation33]. The red vertical line highlights the distance that was calculated by mtsslWizard. The inset shows the DNA (cartoon model) and the modelled spin label (spheres).
![Figure 2. Benchmarking of mtsslWizard. (A) Comparison of version (1.0) of mtsslWizard (grey boxes) with version (1.1) (white circles). Experimental distances that were included in the benchmark data-set of the original mtssWizard paper are plotted against predictions of versions (1.0) and (1.1) of mtsslWizard. The x-axis shows the experimental distance and the y-axis shows the difference of the experimental value to the prediction. The ideal y = 0 line is marked in red, the areas corresponding to different prediction errors are shaded with different colours (green: <3 Å, yellow: ≤5 Å and white: >5 Å). (B) Comparison of experimental distance distributions of the PROXYL-labelled light harvesting complex II (black line, digitised from [Citation12], PDB-ID: 2BHW) with mtsslWizard predictions (red line). (C) Example for the use of the URIP label. The experimental distance distribution is shown in black and the prediction based on the model shown in the inset is shown in red. (D) Example for the use of the C spin label. The experimental distance distribution (black) was constructed using data from [Citation33]. The red vertical line highlights the distance that was calculated by mtsslWizard. The inset shows the DNA (cartoon model) and the modelled spin label (spheres).](/cms/asset/ebf07016-03be-4078-ab69-055073fa65f2/tmph_a_809804_f0002_oc.jpg)
Figure 3. Trilateration of the LOPTC lipid in soybean seed lipoxygenase-1 (SBL1). (A) SBLI is shown as green cartoon model. The MTSSL ensembles that were generated with mtsslWizard are shown as blue and red stick models. The trilateration spheres whose radii correspond to the experimental LOPTC-MTSSL distances are shown in cyan. The trilateration result (‘target’) is represented as an orange ellipsoid and marks the position of the LOPTC lipid. (B) Close up of the ‘target’ area. The protein is shown as green cartoon model; selected amino acid residues are shown as sticks. The target is represented by a translucent orange ellipsoid. The magenta spheres inside the ellipsoid are the results of 10 independent attempts of docking LOPTC into SBLI with mtsslDock (marked by arrow).
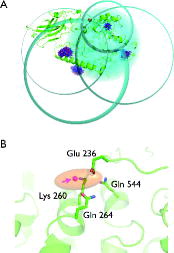
Figure 4. Trilateration of the inhibitory copper-binding site in EcoRI. The EcoRI:DNA complex is shown as a white cartoon model. The MTSSL ensembles that were generated with mtsslWizard are shown as blue and red stick models. The trilateration spheres whose radii correspond to the experimental Cu-MTSSL distances are shown in cyan. All histidine residues in the dimeric structure are highlighted as purple spheres. His114 that was identified as the Cu2+ binding site in [Citation14] is marked and is in the closest proximity to both trilateration spheres. The red spheres (marked by a arrow) represent the result of 10 independent attempts of docking the Cu2+ ion into the complex structure with mtsslDock.
![Figure 4. Trilateration of the inhibitory copper-binding site in EcoRI. The EcoRI:DNA complex is shown as a white cartoon model. The MTSSL ensembles that were generated with mtsslWizard are shown as blue and red stick models. The trilateration spheres whose radii correspond to the experimental Cu-MTSSL distances are shown in cyan. All histidine residues in the dimeric structure are highlighted as purple spheres. His114 that was identified as the Cu2+ binding site in [Citation14] is marked and is in the closest proximity to both trilateration spheres. The red spheres (marked by a arrow) represent the result of 10 independent attempts of docking the Cu2+ ion into the complex structure with mtsslDock.](/cms/asset/abe742da-378b-4710-bcd1-e2f189017ff9/tmph_a_809804_f0004_oc.jpg)
Table 1. Calculated coordinates of spin centres in the molecular coordinate system of soybean seed lipoxygenase-1 (PDB:1YGE) and PELDOR-derived distances between these centres and LOPTC.
Figure 5. Analysis of the mtsslDock algorithm. (A) Benchmark results. Top: Each black or blue dot represents the result of an independent docking run that was performed with the number of constraints indicated on the x-axis. The y-axis (logarithmic scale) represents the RMSD between the ‘experimental’ distances and the distances retrieved from the docking result. The black dots represent the docking runs performed with rubredoxin:rubredoxin-reductase, and the blue dots, the docking runs performed with Cap (see main text). Bottom: The graph is analogue to the top panel but shows the RMSD difference between the docking result and the experimentally found position of the docked molecule. The area with green shading represents RMSD values <2.5 Å, yellow: ≤5 Å, red: >5 Å. (B) Docking results (red, green) for rubredoxin:rubredoxin-reductase (magenta:orange) with seven constraints. (C) Same as B, but 10 constraints were used. (D) Fitness traces of the docking runs for the solutions shown in (B). The traces are coloured according to the solutions in (B).
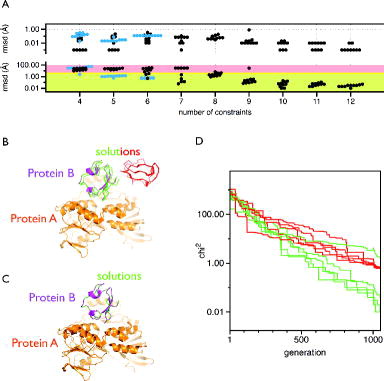
Figure 6. Docking of the cytoplasmic domain of erythrocyte band 3, and ankyrin-R repeats 13–24 [Citation20]. The docking solutions for the ankyrin structure based on 20 PELDOR distances are shown as orange loop models. The erythrocyte band 3 dimer is shown as cartoon model (green and blue). MtsslDock finds two solutions for the problem (solution I and solution II). In the bottom panel, the structure is rotated by 90°.
![Figure 6. Docking of the cytoplasmic domain of erythrocyte band 3, and ankyrin-R repeats 13–24 [Citation20]. The docking solutions for the ankyrin structure based on 20 PELDOR distances are shown as orange loop models. The erythrocyte band 3 dimer is shown as cartoon model (green and blue). MtsslDock finds two solutions for the problem (solution I and solution II). In the bottom panel, the structure is rotated by 90°.](/cms/asset/59693ad4-271b-4416-a27b-29848c2a6b49/tmph_a_809804_f0006_oc.jpg)