Figures & data
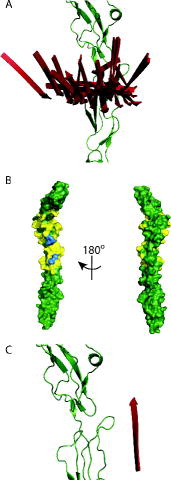
Figure 1. Relevant structures. (A) The MTS nitroxide spin label attached to a cysteine to make an R1 side chain. (B) CD55 from 1OJV.pdb [Citation21] with the positions of mutations shown as blue spheres (CCP, complement control protein module). (C) vWF-A from a chimera of 1RRK.pdb [Citation30] and 1Q0P.pdb [Citation31] to provide a complete structure from residues 243 to 444. The successful mutations are blue spheres, unsuccessful mutations are yellow spheres and the Mg2+ ion is a green sphere.
![Figure 1. Relevant structures. (A) The MTS nitroxide spin label attached to a cysteine to make an R1 side chain. (B) CD55 from 1OJV.pdb [Citation21] with the positions of mutations shown as blue spheres (CCP, complement control protein module). (C) vWF-A from a chimera of 1RRK.pdb [Citation30] and 1Q0P.pdb [Citation31] to provide a complete structure from residues 243 to 444. The successful mutations are blue spheres, unsuccessful mutations are yellow spheres and the Mg2+ ion is a green sphere.](/cms/asset/9749e87f-7882-41be-a4d3-211d0e2bfbfa/tmph_a_827754_f0001_oc.jpg)
Table 1. Complexes marked by a tick are where their DEER time traces pass: (1) the R2 and χ2 background tests; (2) the DeerAnalysis2011 validation tool and (3) where distances are different to distances/distributions extracted from the DEER time traces for the isolated vWF-A or CD55 proteins (see the supporting information). Individual proteins marked by a tick show cases where the DEER time traces deviated from an exponential fitted background as determined by the R2 and χ2 tests.
Figure 2. Experimental results from DEER: (A) Background-corrected DEER for the CD55:vWF-A complexes chosen as justified in the text and the supporting information. (B) Distance distributions from the time traces shown in (A). Each distance distribution is shown in black (good), blue (medium) and red (poor) corresponding to certainty intervals based on the length of the time trace data, as implemented in DeerAnalysis2011. The black horizontal line shows the standard deviation about the mean for the major distance peak, the green line shows the standard deviation about the mean for the MMM results from the hypothesised model (see Section 3.3) and the red star represents the Cα–Cα distance in the model.
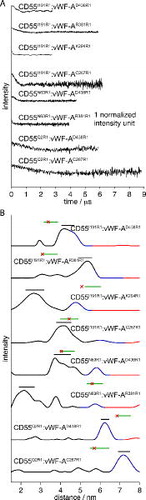
Figure 3. Models for the CD55:vWF-A complex: (A) Relevant chains of 2WII.pdb [Citation33] (fH1-4 and C3b), 2WIN.pdb [Citation34] (C3 and fB) and 1OJV.pdb [Citation21] (CD55). C3b in grey, fH in light green, CD55 in dark green, the vWF-A and serine protease domains of Bb in red and cyan, respectively. (B) The hypothesised model structure for the CD55:vWF-A interaction taken from (A) with the vWF-A coloured from blue to red, N- to C-terminal and CD55 in green.
![Figure 3. Models for the CD55:vWF-A complex: (A) Relevant chains of 2WII.pdb [Citation33] (fH1-4 and C3b), 2WIN.pdb [Citation34] (C3 and fB) and 1OJV.pdb [Citation21] (CD55). C3b in grey, fH in light green, CD55 in dark green, the vWF-A and serine protease domains of Bb in red and cyan, respectively. (B) The hypothesised model structure for the CD55:vWF-A interaction taken from (A) with the vWF-A coloured from blue to red, N- to C-terminal and CD55 in green.](/cms/asset/ca3e2f93-a27b-485a-8273-ee9ea3f978c9/tmph_a_827754_f0003_oc.jpg)
Figure 4. Result from the CNS docking protocol using DEER-derived distances for the CD55:vWF-A complex: (A) Simplified representation of the 52 results from the CNS docking showing only the N-terminal strand of the vWF-A (to show its direction with respect to the CD55 chain) in red and the CD55 in green. (B) CD55 showing residues coloured yellow within 0.5 nm of any of vWF-A from all of the CNS docking results using the DEER-derived distance restraints. The blue residues are R71, L72, N73 (all upper), F171, L173 (both lower). (C) The complex modelled from the crystal structures as shown in using the simplified representation outlined in (A), for comparison.